U.S. Occupational & Physical Therapy Services Market Size, Share & Industry Analysis, By Setting (Hospitals, Outpatient Clinics, and Others), By Application (Orthopedic Therapy, General Therapy, Geriatric Therapy, Pediatric Therapy, Neurological Therapy, and Others), and By Payor (Public Health Insurance and Private Health Insurance/Out-of-pocket), and Country Forecast 2025-2032
KEY MARKET INSIGHTS
The U.S. occupational & physical therapy services market size was valued at USD 59.43 billion in 2024. The market is projected to grow from USD 65.36 billion in 2025 to USD 128.17 billion by 2032, exhibiting a CAGR of 10.1% during the forecast period.
Occupational and physical therapy services are necessary to alleviate the quality of individuals suffering from musculoskeletal disorders, chronic pain, cognitive disabilities, movement disorders, and others. Also, these therapies help in treating short-term disabilities associated with accidental injuries and acute orthopaedic conditions turning into chronic conditions. Currently, the U.S. is witnessing a surge in the demand for occupational and physical therapy services. The rising prevalence of various chronic diseases in the country, coupled with rising awareness among patients regarding proper management of musculoskeletal disorders are the predominant factors propelling the U.S. occupational and physical services market growth.
- Arthritis is one of the most prevalent musculoskeletal disorders reported among the U.S. population. Arthritic conditions, such as osteoarthritis, gout, rheumatoid arthritis, and others, are associated with joint and muscle pain, restricted mobility, and swelling. According to the Centers for Disease Control and Prevention (CDC) 2023 data, during 2019-2021, about 53.2 million of the U.S. adult population had doctor-diagnosed arthritis. Thus, occupational and physical therapies are required to improve or preserve mobility among patients suffering from these conditions.
Additionally, favorable reimbursement policies, the growing number of occupational and physical therapists in the country, and increasing awareness about the benefits of occupational and physical therapies support the adoption of occupational & physical therapy services.
The COVID-19 pandemic adversely affected the U.S. occupational & physical therapy services market in 2020. Reductions in patient visits to outpatient rehabilitation clinics due to the imposition of stringent lockdown regulations in the nation are among the key factors that affected the market during the pandemic. Furthermore, several occupational & physical therapy clinics were closed due to the strict lockdown. Moreover, the impact of COVID-19 affected the business of the key players operating in the market. However, the market experienced a strong rebound during the post-pandemic period owing to the relaxation of the COVID-19 lockdown and increased adoption of telehealth tools in public and private practices.
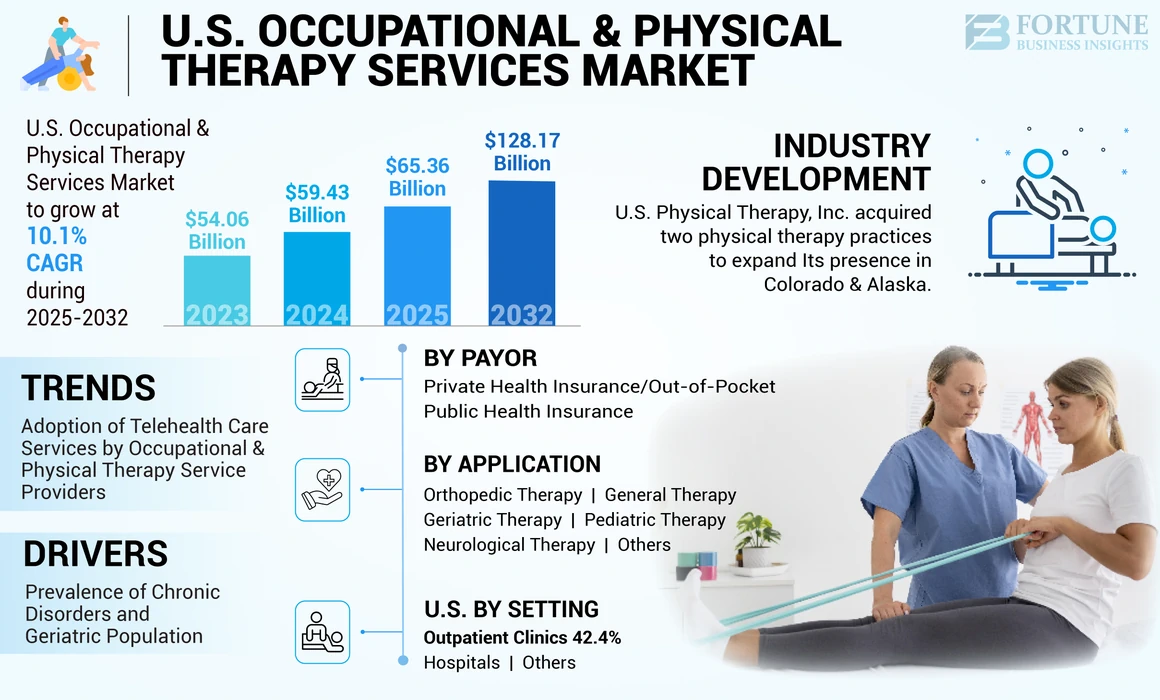
U.S. Occupational & Physical Therapy Services Market Trends
Growing Adoption of Telehealth Care Services by Occupational & Physical Therapy Service Providers Drive Market Expansion
The integration of telehealth in physical and occupational therapy significantly extended the reach and accessibility of rehabilitation services in the U.S. Moreover, the efficiency and convenience offered by telehealth led to an increase in the adoption of these services among healthcare professionals, including physical & occupational therapists in the country. The requirement of face-to-face visits with the physician at least three days a week may be fulfilled using telehealth services.
Furthermore, the government initiatives to support the use of telehealth in order to improve health outcomes are also promoting the adoption of telehealth services by physical & occupational therapists.
- For instance, in September 2023, U.S. senators Steve Daines and Tina Smith reintroduced the Expanded Telehealth Access Act in order to permanently allow virtual access to occupational & physical therapy covered through Medicare.
Moreover, key players shifted their focus to use telehealth platforms in providing physical therapy services to their customers.
- In August 2022, Orbit Telehealth, a prominent player offering virtual musculoskeletal care, launched a platform enabling more than 300,000 brick-and-mortar physical therapists to offer hybrid virtual care.
Download Free sample to learn more about this report.
U.S. Occupational & Physical Therapy Services Market Growth Factors
Rising Prevalence of Chronic Disorders and Geriatric Population to Augment the Market Growth
The increasing prevalence of various chronic conditions, such as cardiopulmonary disease, neurological disorders, musculoskeletal disorders, and others, is raising the demand for occupational & physical therapy services. Moreover, the growing elderly population in the country presents a large patient pool, as most of the chronic conditions are common among older people. Furthermore, falls are the most common cause among the old aged people requiring occupational & physical therapy.
- For instance, according to the statistics published by the Centers for Disease Control and Prevention (CDC) in 2023, approximately 36.0 million falls are reported among the older population each year in the U.S.
Further, occupational and physical therapy has benefits in treating sports injuries. These therapies involve specific exercises targeted for individual injuries rather than a generic approach. Therefore, rising sports injuries in the country are anticipated to raise the demand for these therapies.
- According to the 2023 data published by the National Safety Council, in 2022, an estimated 445,642 injuries were caused owing to exercise equipment, compared to 409,224 injuries in 2021.
Thus, increasing sports-related injuries coupled with the growing prevalence of chronic conditions among the geriatric population is raising the adoption of occupational and physical therapy services, thereby propelling the U.S. occupational & physical therapy services market growth during the forecast period.
Shifting Preference Toward Non-Opioid Alternatives for Pain Management to Propel Market Growth
Another important factor expected to drive market growth is the shifting preference of patients toward physical and occupational therapies instead of medication due to certain side effects associated with medication therapies. This factor and other serious issues, such as misuse of prescriptions, overdose, and related deaths due to opioids, are causing patients to shift from medications to occupational & physical therapy services. Furthermore, significant coverage provided by payors for non-opioid treatment for pain management has raised the demand for these services in the country.
- For instance, according to the 2022 survey report published by the U.S. Pain Foundation, an estimated 9.0% of the U.S. population suffering from pain opted for restorative treatment methods for managing pain. Further, out of all the restorative treatments, physical therapy accounted for 30%.
Furthermore, the long-term benefits associated with physical therapies are anticipated to surge the demand for rehabilitation therapies, including occupational & physical therapy services. Additionally, the increasing patient pool suffering from chronic pain is anticipated to surge the demand for pain management solutions.
Moreover, the growing awareness about the benefits of physical and occupational therapy among patients influences the adoption of these services and is anticipated to drive market growth during the forecast period.
- In September 2022, the companies offering physical therapy care joined the APTA Digital Health Transparency campaign launched by the American Physical Therapy Association to provide improved patient care.
RESTRAINING FACTORS
Reimbursement Capping for Therapies to Impede Market Growth
The majority of the U.S. patients are dependent on medical reimbursements for healthcare expenses. The country's public and private insurance providers are instigating price capping on various physical and occupational therapies, which is anticipated to hamper the adoption of occupational & physical therapy services during the forecast period.
- For instance, according to the 2023 Medicare Outpatient Therapy Cap Explanation article, a cap of USD 2,230.0 per year was levied on occupational therapy services in the U.S. Additionally, USD 2,230.0 was charged for combined speech and physical therapy services.
Moreover, high claim denials associated with occupational and physical therapies are prominent factors restricting market growth. The primary reasons for claim denials are data entry errors, misuse of the modifier codes, failure to establish medical necessity, and eligibility issues. The increasing claim denial rates in the U.S. are accountable for restraining the adoption of occupational & physical therapy services.
U.S. Occupational & Physical Therapy Services Market Segmentation Analysis
By Setting Analysis
Outpatient Clinics Dominated the Market Owing to the Rising Establishment of New Clinics
Based on setting, the market is segmented into hospitals, outpatient clinics, and others.
The outpatient clinics segment held the largest share in 2024 and is anticipated to continue its dominance during the forecast period. The dominance of this segment is attributed to the increasing number of physical therapy outpatient clinics, the surge in the number of industrial accidents in the U.S., and the increasing demand for occupational & physical therapy services in the country.
- For instance, in November 2023, ATI Physical Therapy, an outpatient physical therapy provider in the U.S., established three new clinics. The addition of three new clinics made up a total of 900 clinics by the company.
The hospitals segment is expected to account for the second-largest market share and is anticipated to register a significant CAGR during the forecast period. The surge in the prevalence of chronic diseases and increasing collaborations between market players and hospitals offering physical and occupational therapies are major reasons driving the segment growth.
To know how our report can help streamline your business, Speak to Analyst
By Application Analysis
Orthopedic Therapy Segment Dominated the Market Owing to Increasing Prevalence of Orthopedic Diseases
Based on application, the market is segmented into orthopedic therapy, general therapy, geriatric therapy, pediatric therapy, neurological therapy, and others.
The orthopedic therapy segment dominated the U.S. market in 2024. The growing prevalence of orthopedic diseases and the increasing number of sports injuries are anticipated to drive segment growth. Moreover, increasing cases of bone fractures in the U.S. drive the segment growth.
- As per the Osteoarthritis (OA) Action Alliance, osteoarthritis is the most common form of arthritis affecting citizens of the U.S., with an estimated 32.5 million adults in the country suffering from the condition.
Moreover, neurological therapy is anticipated to grow with the highest CAGR during the forecast period. The growing prevalence of various neurological & cognitive disorders, increase in mobility restriction, and others are a few factors contributing to the market growth. Moreover, the launch of new physical therapy services dedicated to neurological conditions is expected to increase the adoption of the therapy in the upcoming years.
- For instance, in February 2021, ORTHO ILLINOIS launched neurological physical therapy services for patients suffering from neurological conditions such as multiple sclerosis, stroke, Parkinson’s disease, and others.
By Payor Analysis
Private Health Insurance/Out-Of-Pocket Segment’s Growth Led by Increasing Collaborations between Healthcare Institutions
By payor, the market is segmented into public health insurance and private health insurance/out-of-pocket.
The private health insurance/out-of-pocket segment held the largest market share in 2024. The growth is attributed to the increasing number of insurance holders in the country and the increasing collaborations between private health insurance companies and healthcare institutions in the U.S. Further, the market is projected to grow owing to rising initiatives by private insurance companies to cover occupational & physical therapy services.
- According to the U.S. Census Bureau report, in 2022, around 92.1% of the total U.S. population was covered under health insurance, of which 65.6% of the insured comprised private insurance plans. Thus, the increasing number of private insurance holders in the country is likely to support market growth.
Moreover, the public health insurance segment held a significant market share. The growth is attributed to collective initiatives by Medicare, Medicaid, and other public health insurers to provide affordable healthcare to the U.S. people and increase the number of public insurance holders in the country.
List of Key Companies in U.S. Occupational & Physical Therapy Services Market
Select Medical Dominates the Market Owing to Growing Emphasis on Strategic Collaborations
The U.S. occupational & physical therapy services sector is highly fragmented, with many players operating in the market. The top players leading the market include Select Medical, Upstream Rehabilitation Inc., Athletico Physical Therapy, and ATI Physical Therapy. These players hold a significant U.S. occupational & physical therapy services market share due to increasing strategic collaborations, innovative technology launches, and the rising emphasis on inorganic growth strategies for bolstering their market presence.
- In February 2023, Select Medical Corporation entered into a joint venture agreement with AtlantiCare in order to own and manage 13 outpatient physical therapy centres and a new inpatient rehabilitation hospital throughout the southeastern region of New Jersey.
Moreover, other players, such as Enhabit Home Health & Hospice, previously a part of Encompass Health Corporation, U.S. Physical Therapy, and PT SOLUTIONS, continuously engage in strategic expansion initiatives to establish their footprints in emerging regions.
- For instance, in March 2023, U.S. Physical Therapy acquired 80% of the equity of the physical therapy practice of a large clinic.
LIST OF KEY COMPANIES PROFILED:
- ATI Physical Therapy (U.S.)
- Athletico Physical Therapy (U.S.)
- Enhabit Home Health & Hospice (U.S.)
- Upstream Rehabilitation Inc. (U.S.)
- Select Medical (U.S.)
- U.S. Physical Therapy (U.S.)
- PT SOLUTIONS (U.S.)
- LifePoint Health, Inc. (U.S.)
KEY INDUSTRY DEVELOPMENTS:
- September 2022 - U.S. Physical Therapy, Inc., acquired a six-clinic physical therapy practice in West Virginia and Pennsylvania. The company expanded its market presence through this acquisition and strengthened its market position.
- May 2022 – United Healthcare partnered with Kaia Health, a digital therapeutics start-up, to launch a virtual therapy program. Through this program, the eligible patients will receive 24/7 on-demand feedback on physical therapy exercises to complete the physical therapy movements correctly.
- June 2022- Upstream Rehabilitation Inc. acquired Crescent Physical Therapy services provider in South Carolina. With this acquisition, the company aimed to grow and expand its services in more underserved communities in the state.
- February 2022 - Athletico Physical Therapy acquired Pivot Health Solutions, an onsite health and occupational health service provider. Through this acquisition, the company strengthened its market presence in the country's eastern region.
- December 2021 - ATI Physical Therapy acquired Auburn Physical Therapy, comprising four clinics in East Central Michigan. With this acquisition, the company strengthened its position in Michigan with its presence in more than 85 locations.
REPORT COVERAGE
The U.S. market for occupational & physical therapy services report provides a detailed analysis of the market. It focuses on key aspects such as competitive landscape, setting, application, and payor. Besides this, it offers insights into the industry and market trends and highlights key industry developments. In addition to the factors mentioned above, the report encompasses several factors that have contributed to the growth of the market in recent years.
Request for Customization to gain extensive market insights.
Report Scope & Segmentation
|
ATTRIBUTE |
DETAILS |
|
Study Period |
2019-2032 |
|
Base Year |
2024 |
|
Estimated Year |
2025 |
|
Forecast Period |
2025-2032 |
|
Historical Period |
2019-2023 |
|
Growth Rate |
CAGR of 10.1% from 2025-2032 |
|
Unit |
Value (USD Billion) |
|
Segmentation
|
By Setting
|
|
By Application
|
|
|
By Payor
|

Frequently Asked Questions
Fortune Business Insights says that the U.S. market size was valued at USD 59.43 billion in 2024 and is projected to reach USD 128.17 billion by 2032.
The market is expected to exhibit steady growth at a CAGR of 10.1% during the forecast period (2025-2032).
By setting, the outpatient clinics segment to dominate the market.
The increasing prevalence of chronic diseases, the growing burden of the old age population in the U.S., and favorable reimbursement policies are the key drivers of the market.
Select Medical, Upstream Rehabilitation Inc., Athletico Physical Therapy, Encompass Health Corporation, and ATI Physical Therapy are the top players in the market.


- 2019-2032
- 2024
- 2019-2023
- 86
Related Reports
-
US +1 833 909 2966 ( Toll Free )
-
Get In Touch With Us