Virtual Tour Software Market Size, Share, Trends, & COVID-19 Impact Analysis, By Deployment (Cloud and On-premise), By End-user (Real Estate, Education, Tourism & Hospitality, Automotive, and Others), and Regional Forecasts, 2026-2034
KEY MARKET INSIGHTS
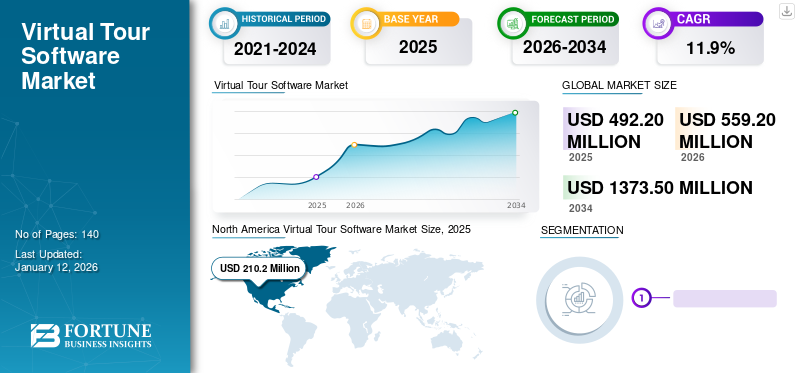
The global virtual tour software market size was valued at USD 492.2 million in 2025 and is projected to grow from USD 559.2 million in 2026 to USD 1373.5 million by 2034, exhibiting a CAGR of 11.9% during the forecast period. North America dominated the global virtual tour software market with a share of 42.7% in 2025. Additionally, the U.S. virtual tour software market is projected to grow significantly, reaching an estimated value of USD 390.9 million by 2032.
Virtual tour software tools are widely adopted for virtual viewing of properties, automotive, tourist places, and others. A virtual tour software uses images, audio, video clips, and 3D maps to generate a 360-degree view of the place. This software provides 360-degree panoramic photos of the location, places, and components. Demand for smartphone-based virtual tourism among consumers and expansion of the global virtual tour software market share across the real estate sector aided market growth.
COVID-19 IMPACT
Closure of Manufacturing and Construction Activities Slightly Increased the Demand for Virtual Reality Products and Services
The COVID-19 pandemic has triggered consumers and businesses to adopt advanced technologies such as virtual reality and virtual touring software for product promotions. During the pandemic, several real estate owners were promoting their flats and houses on a digital virtual reality 360-degree platform. For instance,
- In June 2020, NoBroker, a real estate firm in India, launched virtual reality, analytics, and automation tools for customers in Delhi, India. NoBroker, a real estate firm, launched video walkthroughs and virtual reality tours of flats and houses for owners and tenants in Delhi, India.
Several leading companies in the market are planning to develop customized virtual reality platforms for the real estate, tourism, automotive, and hospitality industries. For example, several tourist companies provide virtual reality software tours of selected tourist spots to showcase their facilities and market their tourism packages. For instance, in April 2022, Tourism of Australia launched a virtual travel service for Indian travelers to explore attractive holiday packages in Australia. The campaign aimed to recover the aviation industry and promote Australia's tourism amid the COVID-19 pandemic.
Also, post the COVID-19 pandemic, the market has shown stable growth owing to the rising adoption of virtual platforms by real estate companies. For instance,
- In May 2022, Geomap, an asset and facility management solution provider, launched a virtual reality software product to manage over 260 million square feet of real estate property.
Such an increase in the adoption among real estate and tourism companies around the globe has propelled market growth.
LATEST TRENDS
Download Free sample to learn more about this report.
Rising Adoption of AI-assisted Chabot Virtual Tours to Bolster Market Expansion
Several companies in the market are adopting artificial intelligence (AI) and cloud computing-based virtual tours across several industries, including automotive, real estate, education, and healthcare. Key players in the market are adopting strategies such as mergers, acquisitions, and partnerships for adopting advanced technologies, such as AI, cloud computing, and analytics tools, to provide product promotions. For instance,
- In March 2021, TMRW Visualization Company launched SpaceWalk, a digital virtual tour software platform that provides photorealistic virtual tours of buildings and shares them with potential buyers. This virtual building tour platform is designed for outdoor and indoor environments and can be viewed on any smart device, including mobiles and laptops.
- In February 2021, Zillow Group, Inc., a real estate company, launched AI-Powered 3D Home interactive floor platform for the home shopper's tours. The new platform plan helped to bring together media content on selling the real estate properties of all Zillow users to access the 3D platform for free.
DRIVING FACTORS
Increasing Technological Advancements and Rising Virtual Reality Tools to Aid Market Growth
Integration of augmented and virtual reality techniques has enhanced the application of virtual reality in various industrial operations. One of the growing applications of virtual reality is the virtual tour software that supports destination-based marketing. Multiple industries, such as education, automotive, manufacturing, security, real estate, tourism, and hospitality, are prominently adopting this software as a new marketing strategy to enhance customer engagement. The marketing strategy is expected to improve customer experience through the virtual solution and boost interactive sessions. For instance,
- In March 2022, Intel Corporation introduced its virtual Intel museum based in California for people across the globe. The company implemented 3D interactive virtual tours for the remote visitor to explore museum content, amble museum floors, and interact with exhibits.
RESTRAINING FACTORS
Lack of Awareness and Information to Customers about Virtual Tour Software and Services Impede Market Growth
The software allows all potential customers to browse and access the information. However, end-users, such as educational institutions, real estate, tourism, and hospitality, can showcase limited data to customers. Customers can have restricted access to the data of the surrounding locations. Tour providers might be unable to provide or restrict the areas they might not want to showcase. This is expected to impact the market growth negatively.
SEGMENTATION
By Deployment Analysis
Rising Adoption of Cloud-based Virtual Touring Software Drives the Market Growth
Based on deployment, the market is divided into cloud and on-premise. In 2026,tThe cloud segment is expected to capture the largest share of 69.4% in the market. The growth is primarily owing to the growing adoption of advanced technology-enabled tour software in real estate, educational institutes, tourism, and hospitality as cloud-based tour software can be accessed from anywhere globally.
Several leading players in the market are developing a cloud-based platform for virtual tours of historical places, hospitality, and real estate properties. Also, increasing cloud spending among enterprises has propelled the deployment of cloud-based virtual tour software by the end-use industries. According to the World Economic Forum, in 2021, cloud services spending in the Asia Pacific region reached USD 48.40 billion.
By End-user Analysis
To know how our report can help streamline your business, Speak to Analyst
Real Estate to Dominate Owing to Rising Adoption by Household Buyers Globally
Based on end-user, the market is segmented into real estate, education, tourism & hospitality, automotive, and others. The real estate segment held a significant market share of 31.71% in 2026. It is expected to grow at a noteworthy CAGR during the forecast period owing to the rising demand from home buyers to list down household properties on the internet using virtual tours. According to Matterport, 92% of home buyers research online before reaching out to an agent and any household properties.
The tourism & hospitality segment is anticipated to grow at the highest CAGR during the forecast period, owing to the growing demand for virtual reality-based software among users. It saves lots of time for shortlisting and making bookings efficiently.
REGIONAL INSIGHTS
North America Virtual Tour Software Market Size, 2025 (USD Million)
To get more information on the regional analysis of this market, Download Free sample
Geographically, the market is studied across North America, Europe, Asia Pacific, the Middle East & Africa, and South America. They are further categorized into countries.
North America
North America is estimated to dominate the market during the forecast period. According to the National Association of Realtors in the U.S., virtual tours received more than 87% more views than those without 360 virtual tours. In addition, more than 50% of buyers would not prefer to visit the website to shortlist the property if they don't provide a 360-degree virtual tour. As a result of these factors, the adoption of virtual tour software is significantly high in the U.S. The U.S. market is valued at USD 167.7 billion by 2026.
Europe
In Europe, the global virtual tour software market growth is driven by rising digitization, and the growing adoption of AI technology in the real estate industry plays an essential role in propelling the growth of the software market in the region. According to research reports by Giraffe360, a real estate agent media provider, virtual tours play a vital role in the post-pandemic period when converting homebuyer interest. Virtual tours account for 20% of all properties in Liverpool and are prevalent in Leicester, Belfast, Manchester, Glasgow, and Huddersfield. The UK market is valued at USD 26.2 billion by 2026, and the Germany market is valued at USD 30.5 billion by 2026.
Asia Pacific
Asia Pacific is growing with the highest CAGR owing to the rising adoption of advanced analytics tools across China and India. Real estate agents' significant adoption of this software to communicate with customers with a 360-degree virtual tour of the property aids the market growth. The Japan market is valued at USD 23.8 billion by 2026, the China market is valued at USD 27.8 billion by 2026, and the India market is valued at USD 18.8 billion by 2026.
Middle East & Africa
Further, the Middle East & Africa region is growing at a moderate pace, owing to the rising adoption of the analytics platform for patent filing with the surge in investment by government authorities. In April 2021, Yas Island, Abu Dhabi's famous holiday destination, provides a virtual tour of the place for travelers with the help of a 360-degree virtual tour platform.
South American countries, such as Brazil and Argentina, have shown moderate adoption of virtual tour software by real estate and tourism companies. After the pandemic, Brazil recorded a 60% surge in international tourists between January 2022 and April 2022. Due to this factor, demand for virtual tours has significantly increased in the country to take virtual tours of places for traveling and making bookings in hotels.
KEY INDUSTRY PLAYERS:
Players are Developing Advanced Technology-based Virtual Tour Software to Expand Market Opportunities
Key players in the market are focused on developing advanced solutions and services by integrating AI, cloud computing, and others. Major players are expanding their services and solutions portfolio by offering solutions across developing nations. The prominent players in the market are developing web-based software by adopting several business strategies such as new product launching, mergers, and acquisitions to remain competitive.
In the scope of the study, we have included companies such as Roundme Limited, RTV, Inc., Concept3D, Inc., Klapty, Kuula LLC, and others that offer this software. Kuula LLC provides 360-degree virtual touring software for real estate properties. Concept3D offers 3D mapping and virtual tour solutions for viewing properties for interactive virtual experiences for their customers.
List of Key Companies Profiled:
- RTV, Inc. (U.S.)
- Concept3D, Inc. (U.S.)
- Klapty (Switzerland)
- Kuula LLC (U.S.)
- Matterport, Inc. (U.S.)
- CloudPano (U.S.)
- My360 (Spain)
- Eyespy360 (England)
- 3DVista Stitcher (Spain)
- Roundme Limited (U.S.)
KEY INDUSTRY DEVELOPMENTS:
- June 2022: Concept3D, Inc. announced a partnership with a higher education engagement hub, Pathify, to offer campus tours through virtual mapping.
- April 2022: Washington-based Mass Interact teamed up with Full Measure Education, to offer virtual tour solutions to enhance campus visits. The partnership aims to improve students’ enrolment and retention, tailored virtual experience, and more.
- March 2022: Concept3D, Inc. announced a strategic collaboration with PlatformQ Education, a software development company, to integrate Concept3D and PlatformQ solution capabilities. The partnership is expected to expand virtual touring along with enhancing virtual experience.
- July 2021: Kuula LLC announced a partnership with Angola-based real estate, AngoCasa, to incorporate virtual tours into its properties.
- May 2021: EyeSpy360 announced a collaboration with real estate sales and marketing developer, Chime, to provide its virtual tour content. The company integrated its software with the website management tool of Chime that offers live tours and virtual walk-ins.
REPORT COVERAGE
An Infographic Representation of Virtual Tour Software Market

 View Full Infographic
To get information on various segments, share your queries with us
The research report highlights leading regions worldwide to understand the user better. Furthermore, the report provides insights into the latest industry and market trends and analyzes technologies deployed rapidly globally. It further highlights some growth-driving factors and restraints, SWOT analysis, and market size to help the reader gain in-depth knowledge about the market.
REPORT SCOPE & SEGMENTATION
|
ATTRIBUTE |
DETAILS |
|
Study Period |
2021-2034 |
|
Base Year |
2025 |
|
Forecast Period |
2026-2034 |
|
Growth Rate |
CAGR of 11.9% from 2026 to 2034 |
|
Historical Period |
2019-2023 |
|
Unit |
Value (USD million) |
|
Segmentation |
By Deployment, End-user, and Region |
|
By Deployment |
|
|
By End-user |
|
|
By Region |
|
Frequently Asked Questions
The global market is projected to reach USD 1373.5 million by 2034.
In 2025, the global market was valued at USD 492.2 million.
The market is projected to grow at a CAGR of 11.9% during the forecast period.
The cloud segment is likely to lead the market.
Increasing technological advancement and rising virtual reality tools aid the market growth.
RTV, Inc., Concept3D, Inc., Matterport, Inc., CloudPano, Kuula LLC, and My360 are the top players in the market.
North America is expected to hold the highest share in the global market.
Tourism & hospitality in the end-user segment is expected to grow with a significant CAGR during the forecast period.


- 2021-2034
- 2024
- 2021-2024
- 140
Related Reports
-
US +1 833 909 2966 ( Toll Free )
-
Get In Touch With Us