Digitization and the advent cloud are spearheading a sea-change in the IT and telecom sector. The rate of innovation in this industry is therefore immensely high. A majority of companies operating in the IT and telecom industry are eager to woo customers by offering them innovative and disruptive technologies. Against this backdrop, a holistic overview of the telecommunication landscape and upcoming developments is imperative for companies - established or fairly new, who aim for a sustainable growth. As per recent studies, a staggering rise in the number of connected devices is on cards. With technology making way for digital transformation, every aspect of running a business will get disrupted in the near future. This also includes the way an organization interact with its customer or the way it explores lucrative prospects. At Fortune Business Insights we understand that every business has some specific requirements hence we offer customized reports, tailored to aid their individual growth targets. Our surveys are supported by relevant data, which we derive from a thorough analysis. Furthermore, our studies cover a vast gamut of sectors within the IT and telecom landscape.
The global docking station market size is projected to grow from $1.93 billion in 2026 to $3.15 billion by 2034, exhibiting a CAGR of 6.3%... Read More
The global cybersecurity market size is projected to grow from $248.28 billion in 2026 to $699.39 billion by 2034, at a CAGR of 13.8% during the forecast period... Read More
The global artificial intelligence engineering market size is projected to grow from $40.79 billion in 2026 to $206.87 billion by 2034, over a CAGR of 22.5%... Read More
The physical AI market size is projected to grow from $42.06 billion in 2026 to $294.07 billion by 2034, at a CAGR of 27.5% during the forecast period... Read More
The global AI cloud infrastructure market size is projected to grow from $58.52 billion in 2026 to $296.91 billion by 2034, exhibiting a CAGR of 22.5%... Read More
The global Internet of Things (IoT) market size is projected to grow from $864.32 billion in 2025 to $5,552.48 billion by 2034, exhibiting a CAGR of 23.10%... Read More
The global digital signage market size is valued at USD 34.42 billion in 2026, projected to reach USD 69.90 billion by 2034 at a CAGR of 9.26% during 2026–2034.... Read More
The global specialty optical fiber market size is projected to grow from $2.31 billion in 2026 to $4.84 billion by 2034, exhibiting a CAGR of 9.7%... Read More
The AI data readiness platforms market size is projected to grow from $13.56 billion in 2026 to $52.25 billion by 2034, over a CAGR of 18.4%... Read More
The global cloud native AI platforms market size is projected to grow from $8.73 billion in 2026 to $47.11 billion by 2034, at a CAGR of 23.5%... Read More
The global modular data center market size is projected to grow from $35.44 billion in 2026 to $116.53 billion by 2034, exhibiting a CAGR of 16.0%... Read More
The global AI model risk management market size is projected to grow from $2.52 billion in 2026 to $12.70 billion by 2034, at a CAGR of 22.4... Read More
The primary objective of these reports is to provide data-driven insights into the health burden, healthcare resources, healthcare infrastructure, healthcare services, and installed base of major medical equipment. These reports can play a critical role in assessing market potential based on healthcare needs and medical device penetration, and in driving strategies aimed at increasing demand for healthcare products.
How Can Our Healthcare Insights Reports Help You?
Assess market potential
Prioritize geographies for expansion
Assess replacement or upgrade opportunities and align product portfolios with the needs of healthcare facilities
Evaluate the attractiveness of regional healthcare markets, infrastructure readiness, and capital investment opportunities
Assess total addressable markets (TAM) and evaluate market readiness for new technologies or products
Healthcare Spending
Global healthcare spending reached USD 11.1 trillion in 2024, driven by evolving healthcare needs resulting from population aging and the increasing burden of chronic diseases.
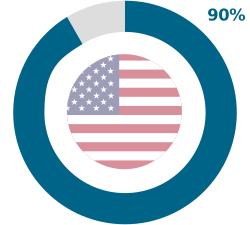
In the United States, approximately 90% of annual healthcare spending is directed toward people with chronic and mental health conditions.
The global population aged 60 years and above is expected to reach 2.1 billion by 2050, accounting for 26% of the world's population.
In 2024, healthcare spending accounted for approximately 10.0% of global GDP. While per capita healthcare spending was around USD 1,354 globally, there is a significant disparity between developed and developing countries.
Per Capita Healthcare Spending
United States
USD 12,740
Japan
USD 3,890
China
USD 675
Indonesia
USD 395
India
USD 102
Healthcare Resources
Number of Physicians per 1,000 Population
High-income countries
3.7
Middle-income countries
2.3
Low-income countries
0.4
Healthcare Infrastructure
In terms of healthcare infrastructure, such as hospitals and hospital beds, there is a significant disparity between developed, developing, and least-developed countries, similar to the disparities observed in healthcare spending and healthcare resources.
Number of Intensive Care Unit Beds per 100,000 Population
High-income countries
12.8
Middle-income countries
5.6
Low-income countries
Less than 2.5
Scope of Our Healthcare Insights Reports
1. Introduction
1.1 Research Scope
1.2 Research Methodology
2. Executive Summary
3. Healthcare Spending (2021-2034)
3.1 Total Healthcare Spending
3.2 Per Capita Healthcare Spending
3.3 Healthcare Spending as a Percentage of GDP
3.4 Healthcare Spending by Source of Funding
4. Healthcare Infrastructure (2025)
4.1 Number of Hospitals
4.2 Number of Public vs. Private Hospitals
4.3 Number of Hospital Beds
4.4 Number of Public vs. Private Hospital Beds
4.5 Number of Intensive Care Unit Beds
4.6 Number of Operating Rooms
4.7 Number of Nursing Homes
4.8 Number of Nursing Home Beds
4.9 Number of Imaging Centers
5. Healthcare Resources (2025)
5.1 Number of Physicians
5.2 Number of Nurses
5.3 Number of Cardiologists
5.4 Number of Neurologists
5.5 Number of Orthopedic Surgeons
5.6 Number of Radiologists
5.7 Number of Dentists
5.8 Number of Pharmacists
6. Installed Base of Medical Equipment (2025)
6.1 Computed Tomography (CT) Scanners
6.2 Magnetic Resonance Imaging (MRI) Systems
6.3 Positron Emission Tomography (PET/CT) Systems
6.4 Ultrasound Systems
6.5 X-ray Systems
6.6 Mammography Systems
6.7 C-arm Systems
6.8 Patient Monitoring Systems
6.9 Catheterization Laboratories
6.10 Ventilators
6.11 Electrocardiography (ECG) Systems
6.12 Dialysis Machines
The following countries can be covered within this scope:
United States
Canada
United Kingdom
Germany
France
Italy
Spain
Turkey
Netherlands
Switzerland
Poland
Belgium
Sweden
Austria
China
Japan
India
South Korea
Australia
Singapore
Malaysia
Indonesia
Thailand
New Zealand
Philippines
Brazil
Mexico
Argentina
South Africa
United Arab Emirates
Saudi Arabia
More...
We can assess the feasibility of providing this data for specific countries not listed above.
Data Sources
Interviews with relevant stakeholders at hospitals/healthcare facilities
Interviews with experts/Key Opinion Leaders (KOLs) with extensive experience in the healthcare market and specialized knowledge of the research scope
Published reports/data from relevant associations
Published reports/data from organizations such as the World Health Organization (WHO), Organisation for Economic Co-operation and Development (OECD), and Eurostat
Published research articles from organizations such as NCBI, ResearchGate, and others
Internal data repository – relevant reports, databases, and customized projects
External databases (free and paid)
Published reports/data from healthcare facilities/healthcare groups, government health departments, and others
GET IN TOUCH WITH US
Why Epidemiology Report?
The primary objective of epidemiology reports is to provide data-driven insights into the incidence,
prevalence, and distribution of diseases across different populations, geographies and time periods.
These reports can play a crucial role in the assessment of market potential based on patient
populations and drive the strategies for the development for healthcare products such as
pharmaceuticals, medical devices, or diagnostics. Epidemiology reports include segmentation by age,
gender, region, and disease stage, enabling companies to make informed decisions about market entry,
product positioning, and clinical trial planning.
HOW CAN OUR EPIDEMIOLOGY REPORTS HELP YOU?
Assist in the estimation of the potential/addressable market based on patient
population
Provide an understanding of the trend in patient population
Provide an overview of the cost of care & therapeutics market
Provide an understanding of the disease landscape
Provide an understanding of the treated patient population
SCOPE OF OUR EPIDEMIOLOGY REPORTS
Overview of the Disease/Condition
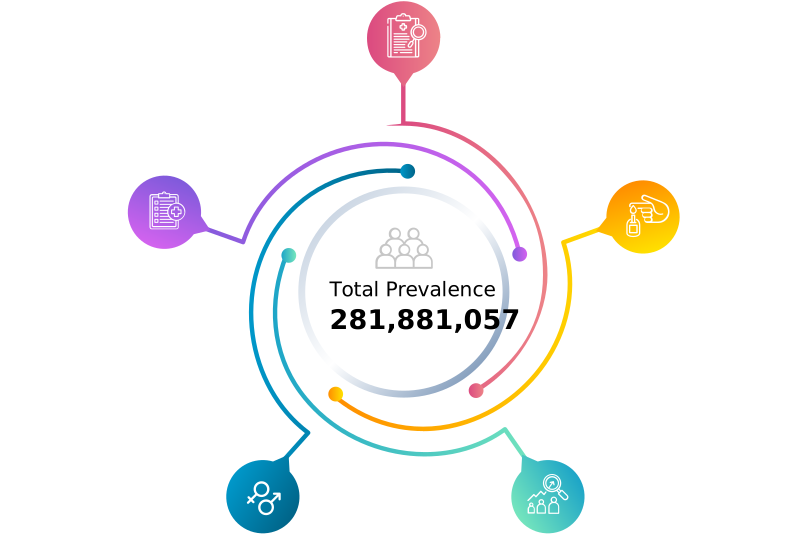
Total Prevalence of the Disease/Condition, 2019–2032
Distribution of the Prevalent Cases by Disease Type,
Age, Gender, 2024
Number of Diagnosed Patients of the Disease/Condition,
2019–2032
Number of Treated Patients of the Disease/Condition,
2019–2032
Cost of Care for the Disease/Condition, 2024
Total Therapeutics Market for the Disease/Condition,
2019–2032
We can check the feasibility of adding specific countries to the geographic scope
based on your requirements.
USA
UK
Germany
France
Italy
Spain
Japan
China
India
Australia
Globally, chronic diseases account for almost three-quarters of all deaths. At present, more than one
in three adults have at least one chronic condition. Unhealthy lifestyle and ageing population are
some of the main factors contributing to the growing burden of non-communicable diseases such as
diabetes and cardiovascular conditions.
The United Nations Population Fund (UNFPA) has projected that the number of people aged 60 years
and above reach around 2.1 billion by 2050 (accounting for around 22% of the global population)
More than 500 million people globally suffer from cardiovascular diseases
Cost of Chronic Diseases
Management of chronic diseases and treatment of conditions due to these chronic diseases
accounts for a significantly large proportion of the total healthcare spending of all
countries, developed as well as
In the U.S., around 90% of the annual healthcare spending is on people suffering
from chronic and mental conditions.
The World Economic Forum estimates that the global cost of treating chronic diseases
will be around USD 30 trillion by 2030.
BURDEN OF CHRONIC DISEASES IN SELECTIVE COUNTRIES
(IN MILLION PATIENTS)
DISEASE INDICATION
U.S
U.K
Germany
France
Italy
Spain
Saudi Arabia
United Arab Emirates
Diabetes
32.5
4.0
6.2
4.0
4.5
5.2
4.4
1.0
Hypertension
148.2
23.2
30.7
22.2
25.3
15.7
15.2
5.3
Kidney Stone
0.67
0.30
0.38
0.29
0.26
0.27
0.13
0.03
Obesity
109.3
23.6
21.3
13.6
10.4
10.3
10.1
3.9
Cancer Epidemiology
Cancer is a group of diseases characterized by the uncontrolled growth and spread of abnormal
cells in the body. If it is not treated, cancer can invade surrounding tissues and spread to
other parts of the body.
Around 20 million new cancer cases are diagnosed every year with men accounting for roughly 51%
of them. China, India, USA and Japan account for around 4% of new cancer cases globally.
Cancer Incidence – Top 10 Countries (in million new cases)
China4.8
USA2.4
India1.4
Japan1.0
Russia0.64
Brazil0.63
Germany0.61
France0.48
UK0.45
Italy0.44
Top 10 Common Cancers (in million new cases)
Type
Cancer Incidence
Trachea, Bronchus & Lung
2.5
Breast
2.3
Colorectum
1.9
Prostate
1.5
Stomach
0.97
Liver
0.87
Thyroid
0.82
Cervix Uteri
0.66
Bladder
0.61
Non-Hodgkin Lymphoma
0.55
Lung Cancer, Breast Cancer, Colorectal Cancer and Prostate Cancer account for around
44% of the new cancer cases (excluding non-melanoma skin cancer).
Diabetes Epidemiology
Diabetes is a chronic medical condition in which the body either doesn't produce enough
insulin or can't effectively use the insulin it produces, leading to elevated levels of
glucose in the blood. Over time, high blood sugar can cause serious damage to the heart,
kidneys, eyes, and nerves.
Around 540 million people suffer from diabetes globally with more than 40% of the cases
undiagnosed.
The two main types of diabetes are Type 1 and Type2. Type 1 is an autoimmune condition
where the body destroys insulin-producing cells, requiring lifelong insulin therapy
whereas Type 2 is a metabolic disorder where the body either doesn't produce enough
insulin or cells become resistant to its effects. Type 2 accounts for around 96% of the
prevalent diabetes cases.
Diabetes Prevalence – Selective Countries (in million cases)
USA32.5
UK4.0
Germany6.2
France4.0
Italy4.5
Spain5.2
Saudi Arabia4.4
UAE1.0
DIABETES EPIDEMIOLOGY REPORT – KEY FINDINGS
Diagnosed Population
56.8%
Undiagnosed Population
43.2%
Population with Diabetes Types
Type 1
12,504,087 (4.4%)
Type 2
269,376,970(95.6%)
Prevalence by Age Group
0–19 yrs
579,276
20–44 yrs
46,553,353
45–64 yrs
91,116,784
>64 yrs
143,631,644
Prevalence by Gender
Men
146,030,908 (51.8%)
Women
135,850,149 (48.2%)
Treatment Rate
48.9%
Diagnosis Rate
56.8%
Kidney Diseases Epidemiology
Conditions that impair the function of the kidneys, which are responsible for filtering waste and
excess fluids from the blood, are known as kidney diseases. These diseases can range from acute
kidney injury to chronic kidney disease (CKD), which may progress to kidney failure if not
managed properly. Common causes include diabetes, high blood pressure, infections, and genetic
disorders.
Globally, around 700 million people are estimated to be suffering from chronic kidney
disease (CKD). Around 14% of adults in the U.S. are estimated to have CKD. Kidney
diseases account for almost 2-4% of the total healthcare budgets in many developed
nations. In the U.S., the annual cost of kidney diseases is estimated to be more than
USD 85 billion.
Around 2 million people worldwide suffer from end-stage renal disease (ESRD), for which
they receive dialysis or kidney transplants.
Patients Receiving Treatment for ESRD - Selective Countries
USA
750,000
Japan
350,000
Brazil
200,000
Germany
80,000
UK
70,000
Rare Diseases Epidemiology
A condition affecting less than 65 per 100,000 people is defined as a rare disease by the WHO.
The global prevalence of more than 7,000 rare diseases together is around 300 million. More than
65% of the patients suffering from rare diseases are children and majority of these diseases do
not have any treatment.
Prevalence of Selective Rare Diseases in the U.S.
Cystic Fibrosis
Lou Gehrig's Disease (ALS)
Huntington's Disease
Duchenne Muscular Dystrophy (DMD)
40,000
18,000
30,000
15,000
Cardiovascular Disease Epidemiology
Cardiovascular diseases (CVDs) are a group of disorders affecting the heart and blood
vessels, including conditions like coronary artery disease, heart failure, stroke, and
hypertension. They are the leading cause of death globally, often resulting from a
combination of lifestyle factors and underlying health conditions.
It is estimated that around 60% of the U.S. adults will have some form of cardiovascular
disease (CVD) in the next 30 years and the cost (direct and indirect) of CVD will be
around USD 1.8 trillion. Globally, around 700 million people are living with CVDs and
CVDs account for around one in three deaths every year.
Hypertension Prevalence – Selective Countries (in million cases)cardio
USA148
UK23
Germany31
France22
Italy22
Spain16
Saudi Arabia15
UAE5
We can prepare Epidemiology Reports for the following list of diseases

 Download Sample
 Buy Now