"Innovative Market Solutions to Help Businesses Make Informed Decisions"

Automotive Ceramics Market Size, Share & COVID-19 Impact Analysis, By Types (Zirconia Oxide Ceramics, Alumina Oxide Ceramics, Titanate Oxide Ceramics, Others), By Application (Automotive Engine Parts, Automotive Electronics, Automotive Exhaust Systems, Others), and Regional Forecast, 2020-2027

Last Updated : April 01, 2024 | Format: PDF | Report ID: FBI103360


KEY MARKET INSIGHTS

Play Audio Listen to Audio Version

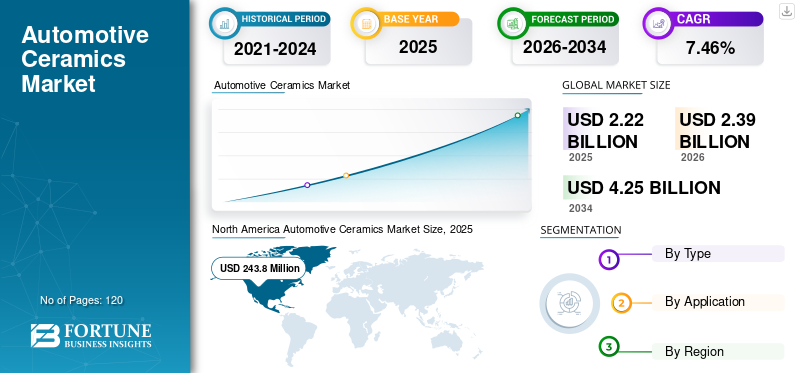
The global automotive ceramics market size was valued at USD 1.47 billion in 2019 and is projected to reach USD 2.11 billion by 2027, exhibiting a CAGR of 5.2% during the forecast period.


Each component of an automobile has specific technical requirements, and the selection of these materials is directed by cost efficiency, maximizing energy, and acceptable reliability properties. These are incorporated into the automotive design to meet the demanding conditions required by the material that is reliable and robust. The electrical and thermal properties of ceramic materials make them suitable for mechanical seals, a variety of sensors, valves, and ceramic bearings. Ceramics are cost-efficient as compared to metals, more durable than plastics, and can be found throughout the automotive industry for advanced car manufacturing that requires high complexity in automotive components.


The adoption of technical ceramic products having properties such as superior mechanical strength, high-edge stability, density, dimensional stability, and abrasion by the manufacturers is propelling the product demand. Additionally, high resistance to chemical corrosion, good thermal conductivity, and electrical insulation across varying temperatures are leading to increased adoption of ceramic products for automotive applications. Ceramics are used in components such as spark plug insulators, emission control devices, and heat sensors. The growing automotive industry and high demand for lightweight vehicles are expected to favour market growth.


Disruptions in Automotive Exports Amid COVID-19 to Affect Growth


The impact of the global pandemic has also integrated into the automotive sector. Disruption over the exports from Chinese large-scale manufacturing companies has created interruptions across Europe. Moreover, in the U.S., the lockdown has caused plant closures which are adding to intense pressure on the global supply base where companies and consumers are at risk. The pandemic has created a global shift in the supply chain that is affecting the automobile industry, which in turn is leading to disruption and downshift in demand for automobile ceramics. The high amount of restrictions over the auto retail sector as dealers are unable to cater to the change in demanding conditions may have an impact on the industry.


Request a Free sample to learn more about this report.


DRIVING FACTORS


Increasing Demand for Metals and Plastics Alternatives to Augment Demand


Changing consumer preferences has limited the availability of raw materials for automakers, along with performance standards and safety, which has caused a limited ability to reduce automobile weight. Light-weight components of every potential vehicle have been under investigation. Material substitution for heavier steel and iron with advanced composites such as plastics, ceramics, magnesium, aluminium, are essentially boosting the vehicle fuel economy. Material substitution majorly depends on the cost, mechanical properties, manufacturing capabilities, and design. Additionally, for the reduction of fuel consumption, enabling weight reduction is essential. Ceramics have better insulation and thermal properties and are cost-efficient, supporting the consumer demand for light-weight automobiles. These properties, combined with advanced production & research methodologies and structures, play an important role in reducing the total weight of the engine and other heat sensor parts of vehicles. Technological advancement further supports the use of advanced ceramics as an alternative material for automotive manufacturing.


Low-Cost Production Technologies to Bode Well for Market Growth


Companies are continuously focusing on the development of low-cost technologies to help contribute towards the high demand for light-weight and affordable vehicles. Ceramics are used in various products such as knock sensors, valve systems, exhaust pipes, and others. Owing to their high melting point and durability, ceramics are ideal materials to use to develop new technologies and reduce the manufacturing cost and weight of vehicles. The introduction of advanced and beneficial technologies are further driving the market growth.


RESTRAINING FACTORS


High Cost of Ceramics to Restrain Growth


The material cost of ceramics is higher than that of metal and other alloys. This may hinder the adoption of ceramics used in automobile manufacturing. High demand for affordable vehicles acts as a restraining factor for the market growth. Technologies supporting low-cost production techniques to reduce the cost of the vehicle also risk the high adoption of ceramics into the automotive industry. Furthermore, the recycling of ceramics is difficult and adds to the issue regarding the use of ceramics in the automotive industry. Thereby restraining the global market of automotive ceramics.


SEGMENTATION


By Type


To know how our report can help streamline your business, Speak to Analyst


Zirconia Oxide Ceramics Segment to Hold a Significant Share


Based on type, the market is segmented into zirconia oxide ceramics, alumina oxide ceramics, titanate oxide ceramics, and others. The zirconia oxide segment holds a major automotive ceramics market share owing to its increasing application in automobile exhaust and engine systems. Zirconium oxide or zirconia is a high resistance material to prevent crack propagation. Zirconium oxide ceramics are thermally expanding and are often the material choice for linking steel and ceramic. Zirconia is frequently used as an electrolyte in oxygen sensor applications owing to the high oxygen ion conduction at raised temperatures. Additionally, some zirconium oxide ceramics materials can conduct oxygen ions and are significantly more expensive than regular zirconia ceramics. Properties of zirconia are supporting the high use of ceramics in the automotive industry, which in turn is driving the overall automotive ceramics industry growth.


Alumina oxide is a white amorphous material used in the automotive industry owing to its good electrical insulation, excellent corrosion resistance, and low dielectric constant properties. These properties contribute a significant application in the automotive industry which are automotive sensors and electrical or electronic insulators in automobiles. Technological advancements in making vehicles safer for consumers are supporting market growth.


By Application


Automotive Engine Parts Segment to hold the Dominant Share


Based on the application, the market for automotive ceramics is segmented into automotive engine parts, automotive electronics, automotive exhaust systems, and others. The automotive engine parts segment will dominate the market during the forecast period. This is attributable to the increasing adoption of the product for the manufacturing of glow plugs, spark plugs, electronic fuel pumps, high-pressure pumps, sealing & insulation rings, valves, and others. The use of ceramic materials in automobiles helps to maintain engine efficiency through the protection of the engine parts. This is the factor that drives the high consumption of ceramics in the automotive industry, thereby leading to market growth.


Automotive ceramics in the exhaust system offer an effective way of purifying vehicle emissions and improving air quality by making the environment cleaner. Ceramic exhaust systems are attached to many diesel vehicles, such as large trucks and heavy machinery, designed specifically to be highly durable and easy to maintenance. A worldwide stringent regulation over vehicular gas emissions is leading to a high demand for the use of ceramics in the exhaust systems of vehicles.


REGIONAL INSIGHTS


North America Automotive Ceramics Market Size, 2019 (USD Million)

To get more information on the regional analysis of this market, Request a Free sample


The market size in North America stood at USD 243.8 million in 2019. Owing to the presence of a large urban population and higher living standards in the region, the market is projected to witness a strong CAGR growth during the forecast period. Companies such as General Motors have, in the past year, witnessed plant layoffs and closures in 2019 with more alliances, investments into electric vehicles, and other new advanced technologies. The U.S. automotive industry has suffered from higher duties on aluminium and steel imports after April 2019 on account of a 90-day suspension of high tariffs on imports from China.


The European region may witness considerable market growth due to the region being the world’s leading producer of automobiles. The automotive industry is the most significant donor to the economy of the European Union. The European Commission aims to identify and assess the policy issues to encourage healthy competition in the automotive industry and recommend feasible solutions by taking into account the environmental, social, and economic goals. The effort to improve the internal market regulation of the automotive industry is expected to favour market growth. Germany is one of the leading automobile producers and accounts for more than 29% of the total European Union automobile market share. Germany produces around 6 million vehicles, including commercial and passenger vehicles, every year. Moreover, German automobile companies have accounted for the manufacturing of 5.5 million automobile units in overseas markets.


Asia Pacific dominates the market and is expected to grow at a faster rate during the forecast period. This is ascribable to the increasing spending habits of consumers in the middle-class category. This growth can be associated with rapid economic expansion in developing countries such as China, India, and Malaysia. Additionally, automotive ceramics manufacturers from the Western region are shifting to the Asia Pacific region on account of leveraging lucrative opportunities, and availability of cheap labor, and less competition. This shift can also be due to an increase in the automotive manufacturing activities within the region, and a cost-effective production hub available is further expected to drive the market.


Latin America is primarily driven by the demand for passenger cars, lower interest rates, and improving economic status of the consumers in countries such as Mexico, Argentina, and Brazil. In Brazil, improved economic conditions and the rising availability of credit will favor the sales of lightweight vehicles. Furthermore, growing investment and increasing demand for export will contribute to the growth of automotive sales. This is expected to lead to market growth in the forthcoming years. The Middle East and Africa market is expected to grow due to the adoption of modern technologies such as internet of things (IoT) in the region. Several public and private companies in the region are digitalizing the business operations to improve productivity. The highly disposable income in gulf countries such as Qatar, Saudi Arabia, and the UAE is a significant factor behind the growth of the automobile industry in the region.


KEY INDUSTRY PLAYERS


Product Innovation by Major Companies Such as IBIDEN to Augur Growth


Product innovation & efficient capacity utilization that leads to problem-solving with innovative technologies cater to the growing demand for automotive ceramics products. IBIDEN is one of the prominent companies related to automotive ceramics. The major companies are forming new strategies constantly that include developing new technologies and creating new products according to consumer demand. Additionally, companies are adopting digital marketing strategies for revenue-boosting.


LIST OF KEY COMPANIES PROFILED:


  • CeramTec (Germany)

  • IBIDEN (Japan)

  • KYOCERA Corporation (Japan)

  • NGK SPARK PLUGS (INDIA) PVT. LTD. (Japan)

  • CoorsTek Inc. (U.S.)

  • Morgan Advanced Materials (UK)

  • Corning Incorporated (U.S.)

  • Saint-Gobain Ceramics (U.S.)

  • Elan Technology (U.S.)

  • Ceradyne, Inc. (U.S.)

  • Other Key Players


KEY INDUSTRY DEVELOPMENTS:


  • In April 2021 – NGK Spark Plug, manufacturers of automotive spark plugs, announced a $100 million fund to invest in startups and find potential merger and acquisition deals. The company’s corporate venture fund is an opportunity to work with startups and expand into new businesses.

  • In April 2020 – Murata Manufacturing Co., Ltd. started mass production of two new multilayer ceramic capacitors for automotive applications. This is a step towards expanding the lineup to meet market needs and contributing to automotive performance and features.


REPORT COVERAGE


An Infographic Representation of Automotive Ceramics Market

To get information on various segments, share your queries with us


The automotive ceramics market research report provides detailed market analysis and focuses on crucial aspects such as leading companies, applications, and types. Also, the report offers insights into market trends and forecasts as well as highlights vital industry developments. In addition to the factors mentioned above, the report encompasses various factors that have contributed to the high growth of the market over recent years.


Report Scope & Segmentation


 ATTRIBUTE


  DETAILS


Study Period


  2016-2027


Base Year 


  2019


Forecast Period


  2020-2027


Historical Period


  2016-2018


Unit


  Value (USD Billion), Volume (Million Ton)


Segmentation


  Type; Application; and Geography


By Type


  • Zirconia Oxide Ceramics

  • Alumina Oxide Ceramics

  • Titanate Oxide Ceramics

  • Others


By Application


  • Automotive Engine Parts

  • Automotive Electronics

  • Automotive Exhaust Systems

  • Others


By Geography


  • North America (the U.S., Canada)

  • Europe (U.K., Germany, France, Spain, Czech Republic and the Rest of Europe)

  • Asia-Pacific (Japan, China, India, South Korea, Malaysia and the Rest of Asia- Pacific)

  • Latin America (Brazil, Mexico,  and the Rest of Latin America)

  • The Middle East & Africa (South Africa, Iran, Saudi Arabia and the Rest of the Middle East & Africa)


Frequently Asked Questions

Fortune Business Insights says that the global market size was valued at USD 1.47 billion in 2019 and is projected to reach USD 2.11 billion by 2027, exhibiting a CAGR of 5.2% during the forecast period.

In 2018, the market value stood at USD 1.47 billion.

Growing at a CAGR of 5.2%, the ceramics will exhibit steady growth during the forecast period (2020-2027).

The automotive engine parts are expected to be the leading segment under the application segment in the market during the forecast period.

The growing need for alternatives to metals and plastics to drive market growth.

CeramTec, IBIDEN, Saint Gobain Ceramic materials, and Corning Incorporated are few of the leading players in the global market.

Asia Pacific dominated the global market in 2019.

Excellent properties and restrictions over gas emissions increase the demand for automotive ceramic products.

Seeking Comprehensive Intelligence on Different Markets?
Get in Touch with Our Experts

Speak to an Expert

Table of Content:

  1. Introduction
    1. Research Scope
    2. Market SegHouseholdtation
    3. Research Methodology
    4. Definitions and Assumptions
  2. Executive Summary
  3. Market Dynamics
    1. Market Drivers
    2. Market Restraints
    3. Market Opportunities
    4. Emerging Trends
  4. Key Insights
    1. Overview of the Parent/Related Markets
    2. Industry SWOT Analysis
    3. Regulatory Analysis
    4. Recent Industry Developments - Policies, Partnerships, New Product  Launches, and Mergers & Acquisitions
  5. Global Automotive Ceramics Market Analysis, Insights and Forecast, 2016-2027
    1. Key Findings / Summary
    2. Market Size Estimates and Forecast 
      1. By Type (Volume/Value)
        1. Zirconia Oxide Ceramics
        2. Alumina Oxide Ceramics
        3. Titanate Oxide Ceramics
        4. Others
      2. By Application (Volume/Value)
        1. Automotive Engine Parts
        2. Automotive Electronics
        3. Automotive Exhaust Systems
        4. Others
      3. By Region (Volume/Value)
        1. North America
        2. Europe
        3. Asia Pacific
        4. Latin America
        5. Middle East & Africa
  6. North America Automotive Ceramics Market Analysis, Insights and Forecast, 2016-2027
    1. Key Findings / Summary
    2. Market Size Estimates and Forecast 
      1. By Type (Volume/Value)
        1. Zirconia Oxide Ceramics
        2. Alumina Oxide Ceramics
        3. Titanate Oxide Ceramics
        4. Others
      2. By Application (Volume/Value)
        1. Automotive Engine Parts
        2. Automotive Electronics
        3. Automotive Exhaust Systems
        4. Others
      3. By Country (Volume/Value)
        1. U.S.
          1. By Application (Volume/Value)
            1. Automotive Engine Parts
            2. Automotive Electronics
            3. Automotive Exhaust Systems
            4. Others
        2. Canada
          1. By Application (Volume/Value)
            1. Automotive Engine Parts
            2. Automotive Electronics
            3. Automotive Exhaust Systems
            4. Others
  7. Europe Automotive Ceramics Market Analysis, Insights and Forecast, 2016-2027
    1. Key Findings / Summary
    2. Market Size Estimates and Forecast 
      1. By Type (Volume/Value)
        1. Zirconia Oxide Ceramics
        2. Alumina Oxide Ceramics
        3. Titanate Oxide Ceramics
        4. Others
      2. By Application (Volume/Value)
        1. Automotive Engine Parts
        2. Automotive Electronics
        3. Automotive Exhaust Systems
        4. Others
      3. By Country (Volume/Value)
        1. Germany
          1. By Application (Volume/Value)
            1. Automotive Engine Parts
            2. Automotive Electronics
            3. Automotive Exhaust Systems
            4. Others
        2. France
          1. By Application (Volume/Value)
            1. Automotive Engine Parts
            2. Automotive Electronics
            3. Automotive Exhaust Systems
            4. Others
        3. UK
          1. By Application (Volume/Value)
            1. Automotive Engine Parts
            2. Automotive Electronics
            3. Automotive Exhaust Systems
            4. Others
        4. Czech Republic
          1. By Application (Volume/Value)
            1. Automotive Engine Parts
            2. Automotive Electronics
            3. Automotive Exhaust Systems
            4. Others
        5. Spain
          1. By Application (Volume/Value)
            1. Automotive Engine Parts
            2. Automotive Electronics
            3. Automotive Exhaust Systems
            4. Others
        6. Rest of Europe
          1. By Application (Volume/Value)
            1. Automotive Engine Parts
            2. Automotive Electronics
            3. Automotive Exhaust Systems
            4. Others
  8. Asia-Pacific Automotive Ceramics Market Analysis, Insights and Forecast, 2016-2027
    1. Key Findings / Summary
    2. Market Size Estimates and Forecast 
      1. By Type (Volume/Value)
        1. Zirconia Oxide Ceramics
        2. Alumina Oxide Ceramics
        3. Titanate Oxide Ceramics
        4. Others
      2. By Application (Volume/Value)
        1. Automotive Engine Parts
        2. Automotive Electronics
        3. Automotive Exhaust Systems
        4. Others
      3. By Country (Volume/Value)
        1. China
          1. By Application (Volume/Value)
            1. Automotive Engine Parts
            2. Automotive Electronics
            3. Automotive Exhaust Systems
            4. Others
        2. India
          1. By Application (Volume/Value)
            1. Automotive Engine Parts
            2. Automotive Electronics
            3. Automotive Exhaust Systems
            4. Others
        3. Japan
          1. By Application (Volume/Value)
            1. Automotive Engine Parts
            2. Automotive Electronics
            3. Automotive Exhaust Systems
            4. Others
        4. South Korea
          1. By Application (Volume/Value)
            1. Automotive Engine Parts
            2. Automotive Electronics
            3. Automotive Exhaust Systems
            4. Others
        5. Malayasia
          1. By Application (Volume/Value)
            1. Automotive Engine Parts
            2. Automotive Electronics
            3. Automotive Exhaust Systems
            4. Others
        6. Rest of Asia-Pacific
          1. By Application (Volume/Value)
            1. Automotive Engine Parts
            2. Automotive Electronics
            3. Automotive Exhaust Systems
            4. Others
  9. Latin America Automotive Ceramics Market Analysis, Insights and Forecast, 2016-2027
    1. Key Findings / Summary
    2. Market Size Estimates and Forecast
      1. By Type (Volume/Value)
        1. Zirconia Oxide Ceramics
        2. Alumina Oxide Ceramics
        3. Titanate Oxide Ceramics
        4. Others
      2. By Application (Volume/Value)
        1. Automotive Engine Parts
        2. Automotive Electronics
        3. Automotive Exhaust Systems
        4. Others
      3. By Country (Volume/Value)
        1. Brazil
          1. By Application (Volume/Value)
            1. Automotive Engine Parts
            2. Automotive Electronics
            3. Automotive Exhaust Systems
            4. Others
        2. Mexico
          1. By Application (Volume/Value)
            1. Automotive Engine Parts
            2. Automotive Electronics
            3. Automotive Exhaust Systems
            4. Others
        3. Rest of Latin America
          1. By Application (Volume/Value)
            1. Automotive Engine Parts
            2. Automotive Electronics
            3. Automotive Exhaust Systems
            4. Others
  10. Middle East & Africa Automotive Ceramics Market Analysis, Insights and Forecast, 2016-2027
    1. Key Findings / Summary
    2. Market Size Estimates and Forecast 
      1. By Type (Volume/Value)
        1. Zirconia Oxide Ceramics
        2. Alumina Oxide Ceramics
        3. Titanate Oxide Ceramics
        4. Others
      2. By Application (Volume/Value)
        1. Automotive Engine Parts
        2. Automotive Electronics
        3. Automotive Exhaust Systems
        4. Others
      3. By Country (Volume/Value)
        1. Iram
          1. By Application (Volume/Value)
            1. Automotive Engine Parts
            2. Automotive Electronics
            3. Automotive Exhaust Systems
            4. Others
        2. Saudi Arabia
          1. By Application (Volume/Value)
            1. Automotive Engine Parts
            2. Automotive Electronics
            3. Automotive Exhaust Systems
            4. Others
        3. South Africa
          1. By Application (Volume/Value)
            1. Automotive Engine Parts
            2. Automotive Electronics
            3. Automotive Exhaust Systems
            4. Others
        4. Rest of Middle East & Africa
          1. By Application (Volume/Value)
            1. Automotive Engine Parts
            2. Automotive Electronics
            3. Automotive Exhaust Systems
            4. Others
  11. Competitive Matrix
    1. Business Strategies Adopted by Leading Players
    2. Global Automotive Ceramics Market Revenue Share/Ranking Analysis, By Key Manufacturer
  12. Company Profiles
    1. CeramTec (Germany)
      1. Overview
      2. Description
      3. Product  Portfolio
      4. Financials (Data as available in public domain and/or on paid databases)
      5. Recent Developments
    2. IBIDEN (Japan)
      1. Overview
      2. Description
      3. Product  Portfolio
      4. Financials (Data as available in public domain and/or on paid databases)
      5. Recent Developments
    3. KYOCERA Corporation (Japan)
      1. Overview
      2. Description
      3. Product  Portfolio
      4. Financials (Data as available in public domain and/or on paid databases)
      5. Recent Developments
    4. NGK SPARK PLUGS (INDIA) PVT. LTD. (Japan)
      1. Overview
      2. Description
      3. Product  Portfolio
      4. Financials (Data as available in public domain and/or on paid databases)
      5. Recent Developments
    5. CoorsTek Inc. (U.S.)
      1. Overview
      2. Description
      3. Product  Portfolio
      4. Financials (Data as available in public domain and/or on paid databases)
      5. Recent Developments
    6. Morgan Advanced Materials (UK)
      1. Overview
      2. Description
      3. Product  Portfolio
      4. Financials (Data as available in public domain and/or on paid databases)
      5. Recent Developments
    7. Corning Incorporated (U.S.)
      1. Overview
      2. Description
      3. Product  Portfolio
      4. Financials (Data as available in public domain and/or on paid databases)
      5. Recent Developments
    8. Saint-Gobain Ceramics (U.S.)
      1. Overview
      2. Description
      3. Product  Portfolio
      4. Financials (Data as available in public domain and/or on paid databases)
      5. Recent Developments
    9. Elan Technology (U.S.)
      1. Overview
      2. Description
      3. Product  Portfolio
      4. Financials (Data as available in public domain and/or on paid databases)
      5. Recent Developments
    10. Ceradyne, Inc. (U.S.)
      1. Overview
      2. Description
      3. Product  Portfolio
      4. Financials (Data as available in public domain and/or on paid databases)
      5. Recent Developments
    11. Other Key Players
      1. Overview
      2. Description
      3. Product  Portfolio
      4. Financials (Data as available in public domain and/or on paid databases)
      5. Recent Developments
  13. Appendix


List of Tables

Table 1   Global Automotive Ceramics Market Revenue (USD Bn) Forecast, 2016–2027

Table 2   Global volume (Million Ton) Forecast, 2016–2027

Table 3   Global Revenue (USD Bn) Forecast, by Type, 2016–2027

Table 4   Global volume (Million Ton) Forecast, by Type, 2016–2027

Table 5   Global Revenue (USD Bn) Forecast, by Application, 2016–2027

Table 6   Global volume (Million Ton) Forecast, by Application, 2016–2027

Table 7   Global Revenue (USD Bn) Forecast, by Region,  2016–2027

Table 8   Global volume (Million Ton) Forecast, by Region, 2016–2027

Table 9   North America Revenue (USD Bn) Forecast, 2016–2027

Table 10 North America Volume (Million Ton) Forecast, 2016–2027

Table 11 North America Revenue (USD Bn) Forecast, by Type,  2016–2027

Table 12 North America Volume (Million Ton) Forecast, by Type, 2016–2027

Table 13 North America Revenue (USD Bn) Forecast, by Application,  2016–2027

Table 14 North America Volume (Million Ton) Forecast, by Application, 2016–2027

Table 15 North America Revenue (USD Bn) Forecast, by Country, 2016–2027

Table 16 North America Volume (Million Ton) Forecast, by Country, 2016–2027

Table 17 Europe Revenue (USD Bn) Forecast, 2016–2027

Table 18 Europe Voulme (Million Ton) Forecast, 2016–2027

Table 19 Europe Revenue (USD Bn) Forecast, by Type, 2016–2027

Table 20 Europe Voulme (Million Ton) Forecast, by Type, 2016–2027

Table 21 Europe Revenue (USD Bn) Forecast, by Application, 2016–2027

Table 22 Europe Voulme (Million Ton) Forecast, by Application, 2016–2027

Table 23 Europe Revenue (USD Bn) Forecast, by Country, 2016–2027

Table 24 Europe Volume (Million Ton) Forecast, by Country 2016–2027

Table 25 Asia Pacific Revenue (USD Bn) Forecast, 2016–2027

Table 26 Asia Pacific Volume (Million Ton) Forecast, 2016–2027

Table 27 Asia Pacific Revenue (USD Bn) Forecast, by Type, 2016–2027

Table 28 Asia Pacific Voulme (Million Ton) Forecast, by Type, 2016–2027

Table 29 Asia Pacific Revenue (USD Bn) Forecast, by Application, 2016–2027

Table 30 Asia Pacific Voulme (Million Ton) Forecast, by Application, 2016–2027

Table 31 Asia Pacific Revenue (USD Bn) Forecast, by Country, 2016–2027

Table 32 Asia Pacific Volume (Million Ton) Forecast, by Country, 2016–2027

Table 33 Latin America Revenue (USD Bn) Forecast, 2016–2027

Table 34 Latin America Volume (Million Ton) Forecast, 2016–2027

Table 35 Latin America Revenue (USD Bn) Forecast, by Type, 2016–2027

Table 36 Latin America Volume (Million Ton) Forecast, by Type, 2016–2027

Table 37 Latin America Revenue (USD Bn) Forecast, by Application, 2016–2027

Table 38 Latin America Volume (Million Ton) Forecast, by Application, 2016–2027

Table 39 Latin America Revenue (USD Bn) Forecast, by Country, 2016–2027

Table 40 Latin America Volume (Million Ton) Forecast, by Country, 2016–2027

Table 41 Middle East & Africa Revenue (USD Bn) Forecast, 2016–2027

Table 42 Middle East & Africa Volume (Million Ton) Forecast, 2016–2027

Table 43 Middle East & Africa Revenue (USD Bn) Forecast, by Type, 2016–2027

Table 44 Middle East & Africa Volume (Million Ton) Forecast, by Type, 2016–2027

Table 45 Middle East & Africa Revenue (USD Bn) Forecast, by Application, 2016–2027

Table 46 Middle East & Africa Volume (Million Ton) Forecast, by Application, 2016–2027

Table 47 Middle East & Africa Revenue (USD Bn) Forecast, by Country, 2016–2027

Table 48 Middle East & Africa Volume (Million Ton) Forecast, by Country, 2016–2027


List of Figures

Figure 1 Global Revenue (USD Bn) Breakdown by Type, 2020 & 2027

Figure 2 Global Revenue (KT) Breakdown by Type, 2020 & 2027

Figure 3 Global Revenue (USD Bn) Breakdown by Application, 2020 & 2027

Figure 4 Global Revenue (KT) Breakdown by Application, 2020 & 2027

Figure 5 Global Revenue (USD Bn) Breakdown by Region, 2020 & 2027

Figure 6 Global Revenue (KT) Breakdown by Region, 2020 & 2027

Figure 7 Global Share (%) by Type, 2019 & 2027

Figure 8 Global Share (%) by Type, 2019 & 2027

Figure 9 Global Share (%) by Application, 2019 & 2027

Figure 10 Global Share (%) by Application, 2019 & 2027

Figure 11 Global Share (%) by Region, 2019 & 2027

Figure 12 Global Share (%) by Region, 2019 & 2027

Figure 13 North America Value (USD Bn) by Type, 2020 & 2027

Figure 14 North America Volume (KT) by Type, 2020 & 2027

Figure 15 North America Value Share (%) by Type, 2019

Figure 16 North America Value Share (%) by Type, 2019

Figure 17 North America Value (USD Bn) by Application, 2020 & 2027

Figure 18 North America Volume (KT) by Application, 2020 & 2027

Figure 19 North America Value Share (%) by Application, 2019

Figure 20 North America Value Share (%) by Application, 2019

Figure 21 North America Value (USD Bn) by Region, 2020 & 2027

Figure 22 North America Volume (KT) by Region, 2020 & 2027

Figure 23 North America Value Share (%) by Region, 2019

Figure 24 North America Volume Share (%) by Region, 2019

Figure 25 North America Value (USD Bn) by Country, 2020 & 2027

Figure 26 North America Volume (KT) by Country, 2020 & 2027

Figure 27 North America Value Share (%) by Country, 2019

Figure 28 North America Volume Share (%) by Country, 2019

Figure 29 Europe Value (USD Bn) by Type , 2020 & 2027

Figure 30 Europe Volume (KT) by Type, 2020 & 2027

Figure 31 Europe Value Share (%) by Type, 2019

Figure 32 Europe Volume Share (%) by Type, 2019

Figure 33 Europe Value (USD Bn) by Application, 2020 & 2027

Figure 34 Europe Volume (KT) by Application, 2020 & 2027

Figure 35 Europe Value Share (%) by Application, 2019

Figure 36 Europe Volume Share (%) by Application, 2019

Figure 37 Europe Value (USD Bn) by Region, 2020 & 2027

Figure 38 Europe Volume (KT) by Region, 2020 & 2027

Figure 39 Europe Value Share (%) by Region, 2019

Figure 40 Europe Volume Share (%) by Region, 2019

Figure 41 Europe Value (USD Bn) by Country, 2020 & 2027

Figure 42 Europe Volume (KT) by Country, 2020 & 2027

Figure 43 Europe Value Share (%) by Country, 2019

Figure 44 Europe Volume Share (%) by Country, 2019

Figure 45 Asia Pacific Value (USD Bn) by Type, 2020 & 2027

Figure 46 Asia Pacific Volume (KT) by Type, 2020 & 2027

Figure 47 Asia Pacific Value Share (%) by Type, 2019

Figure 48 Asia Pacific Volume Share (%) by Type, 2019

Figure 49 Asia Pacific Value (USD Bn) by Application, 2020 & 2027

Figure 50 Asia Pacific Volume (KT) by Application, 2020 & 2027

Figure 51 Asia Pacific Value Share (%) by Application, 2019

Figure 52 Asia Pacific Volume Share (%) by Application, 2019

Figure 53 Asia Pacific Value (USD Bn) by Region, 2020 & 2027

Figure 54 Asia Pacific Volume (KT) by Region, 2020 & 2027

Figure 55 Asia Pacific Value Share (%) by Region, 2019

Figure 56 Asia Pacific Volume Share (%) by Region, 2019

Figure 57 Asia Pacific Value (USD Bn) by Country, 2020 & 2027

Figure 58 Asia Pacific Volume (KT) by Country, 2020 & 2027

Figure 59 Asia Pacific Value Share (%) by Country, 2019

Figure 60 Asia Pacific Volume Share (%) by Country, 2019

Figure 61 Latin America Value (USD Bn) by Type, 2020 & 2027

Figure 62 Latin America Volume (KT) by Type, 2020 & 2027

Figure 63 Latin America Value Share (%) by Type, 2019

Figure 64 Latin America Value Share (%) by Type, 2019

Figure 65 Latin America Value (USD Bn) by Application, 2020 & 2027

Figure 66 Latin America Volume (KT) by Application, 2020 & 2027

Figure 67 Latin America Value Share (%) by Application, 2019

Figure 68 Latin America Value Share (%) by Application, 2019

Figure 69 Latin America Value (USD Bn) by Region, 2020 & 2027

Figure 70 Latin America Volume (KT) by Region, 2020 & 2027

Figure 71 Latin America Value Share (%) by Region, 2019

Figure 72 Latin America Volume Share (%) by Region, 2019

Figure 73 Latin America Value (USD Bn) by Country, 2020 & 2027

Figure 74 Latin America Volume (KT) by Country, 2020 & 2027

Figure 75 Latin America Value Share (%) by Country, 2019

Figure 76 Latin America Volume Share (%) by Country, 2019

Figure 77 Middle East & Africa Value (USD Bn) by Type, 2020 & 2027

Figure 78 Middle East & Africa Value (USD Bn) by Type, 2020 & 2027

Figure 79 Middle East & Africa Value Share (%) by Type, 2019

Figure 80 Middle East & Africa Value Share (%) by Type, 2019

Figure 81 Middle East & Africa Value (USD Bn) by Application, 2020 & 2027

Figure 82 Middle East & Africa Value (USD Bn) by Application, 2020 & 2027

Figure 83 Middle East & Africa Value Share (%) by Application, 2019

Figure 84 Middle East & Africa Value Share (%) by Application, 2019

Figure 85 Middle East & Africa Value (USD Bn) by Region, 2020 & 2027

Figure 86 Middle East & Africa Volume (KT) by Region, 2020 & 2027

Figure 87 Middle East & Africa Value Share (%) by Region, 2019

Figure 88 Middle East & Africa Volume Share (%) by Region, 2019

Figure 89 Middle East & Africa Value (USD Bn) by Country, 2020 & 2027

Figure 90 Middle East & Africa Volume (KT) by Country, 2020 & 2027

Figure 91 Middle East & Africa Value Share (%) by Country, 2019

Figure 92 Middle East & Africa VolumeShare (%) by Country, 2019

Figure 93 Global Revenue (%) Share Analysis by Key Players, 2019

  • REPORT UPDATE
    IN PROCESS
  • 2019-2032
    (In Process)
  • 2023
    (In Process)

Personalize this Research

  • Granular Research on Specified Regions or Segments
  • Companies Profiled based on User Requirement
  • Broader Insights Pertaining to a Specific Segment or Region
  • Breaking Down Competitive Landscape as per Your Requirement
  • Other Specific Requirement on Customization
Request Customization Banner

Chemicals & Materials Clients

UBS
uniliver
Mobil
Citibank
3M

Client Testimonials

“This report is really well done and we really appreciate it! Again, I may have questions as we dig in deeper. Thanks again for some really good work.”

- U.S.-based biotechnology company focussing on treatment of chronic pain.

“Kudos to your team. Thank you very much for your support and agility to answer our questions.”

- Europe-based provider of solutions to automate data centre operations.

“We appreciate you and your team taking out time to share the report and data file with us, and we are grateful for the flexibility provided to modify the document as per request. This does help us in our business decision making. We would be pleased to work with you again, and hope to continue our business relationship long into the future.”

- India-based manufacturer of industrial and specialty intermediates with a strong global presence.

“I want to first congratulate you on the great work done on the Medical Platforms project. Thank you so much for all your efforts.”

- One of the largest cosmetics company in the world.

“Thank you very much. I really appreciate the work your team has done. I feel very comfortable recommending your services to some of the other startups that I’m working with, and will likely establish a good long partnership with you.”

- U.S. based startup operating in the cultivated meat market.

“We received the below report on the U.S. market from you. We were very satisfied with the report.”

- Global hearing aids manufacturer.

“I just finished my first pass-through of the report. Great work! Thank you!”

- U.S. based solar racking solutions provider.

“Thanks again for the great work on our last partnership. We are ramping up a new project to understand the imaging and imaging service and distribution market in the U.S.”

- World’s leading advisory firm.

“We feel positive about the results. Based on the presented results, we will do strategic review of this new information and might commission a detailed study on some of the modules included in the report after end of the year. Overall we are very satisfied and please pass on the praise to the team. Thank you for the co-operation!”

- Germany based machine construction company.

“Thank you very much for the very good report. I have another requirement on cutting tools, paper crafts and decorative items.”

- Japanese manufacturing company of stationery products.

“We are happy with the professionalism of your in-house research team as well as the quality of your research reports. Looking forward to work together on similar projects”

- One of the Leading Food Companies in Germany

“We appreciate the teamwork and efficiency for such an exhaustive and comprehensive report. The data offered to us was exactly what we were looking for. Thank you!”

- Intuitive Surgical

“I recommend Fortune Business Insights for their honesty and flexibility. Not only that they were very responsive and dealt with all my questions very quickly but they also responded honestly and flexibly to the detailed requests from us in preparing the research report. We value them as a research company worthy of building long-term relationships.”

- Major Food Company in Japan

“Well done Fortune Business Insights! The report covered all the points and was very detailed. Looking forward to work together in the future”

- Ziering Medical

“It has been a delightful experience working with you guys. Thank you Fortune Business Insights for your efforts and prompt response”

- Major Manufacturer of Precision Machine Parts in India

“I had a great experience working with Fortune Business Insights. The report was very accurate and as per my requirements. Very satisfied with the overall report as it has helped me to build strategies for my business”

- Hewlett-Packard

“This is regarding the recent report I bought from Fortune Business insights. Remarkable job and great efforts by your research team. I would also like to thank the back end team for offering a continuous support and stitching together a report that is so comprehensive and exhaustive”

- Global Management Consulting Firm

“Please pass on our sincere thanks to the whole team at Fortune Business Insights. This is a very good piece of work and will be very helpful to us going forward. We know where we will be getting business intelligence from in the future.”

- UK-based Start-up in the Medical Devices Sector

“Thank you for sending the market report and data. It looks quite comprehensive and the data is exactly what I was looking for. I appreciate the timeliness and responsiveness of you and your team.”

- One of the Largest Companies in the Defence Industry
We use cookies to enhance your experience. By continuing to visit this site you agree to our use of cookies . Privacy.
X