Cross Laminated Timber Market Size, Share & Industry Analysis, By Bonding Technology (Adhesive Bonded and Mechanically Fastened), By Application (Residential Buildings, Non-Residential Buildings, and Others), and Regional Forecast, 2026-2034
KEY MARKET INSIGHTS
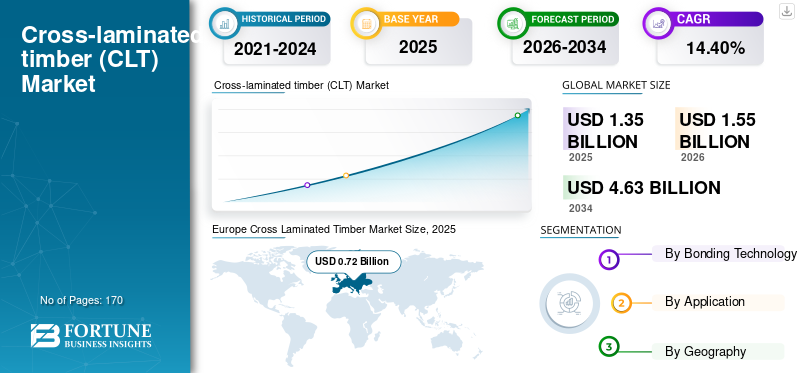
The global cross laminated timber market size was USD 1.35 billion in 2025 and is projected to grow from USD 1.55 billion in 2026 to USD 4.63 billion in 2034 at a CAGR of 14.40% during the forecast period (2026-2034). Europe dominated the cross-laminated timber market with a market share of 53.70% in 2025.
Cross laminated timber, also called as CLT or XLam, is a pre-assembled engineered wood lumber product consisting of more than two layers of solid-sawn or structural composite timber. The layers are laid such that the adjoining layers are cross-oriented and are bonded with an adhesive or a mechanical fastening to form a solid wood element. It was developed in Alpine countries of Europe in the early 1990s and is now a well-established building material in Europe, and is gaining popularity in North America and Asia Pacific countries. It is used majorly in the construction of prefabricated building structures or to construct buildings on-site in a small duration. Structurlam estimates building installation of up to 14000 sq.ft. per day with a team of 6 technicians, whereas construction activities of a similar scale using conventional products may have a lead time of multiple weeks with a significantly higher amount of labor. It provides advantages such as design flexibility and good seismic performance. It also shows good acoustic and thermal insulation performance and is an environmentally sustainable material. These factors have led to the adoption of the material in the construction of many buildings in Europe and North America.
The COVID-19 pandemic caused disruption in the supply chain by affecting the supply of wood and reducing demand from the construction industry, negatively impacting the market growth. On the contrary, the pandemic has further invigorated the demand for sustainable construction materials. It is now projected that the materials demand shall grow at a greater growth rate in the medium and long term.
Download Free sample to learn more about this report.
Global Cross Laminated Timber Market Overview
Market Size & Forecast:
- 2025 Market Size: USD 1.35 billion
- 2026 Market Size: USD 1.55 billion
- 2034 Forecast Market Size: USD 4.63 billion
- CAGR: 14.40% from 2026–2034
Market Share:
- Europe dominated the cross laminated timber market with a 53.70% share in 2025.
Regional Insights
- Europe: Market size USD 590.5 million in 2023; leads due to extensive use in small/medium houses and accounts for 65% of global timber-based wood production.
- North America: Growth driven by hybrid timber-conventional constructions for innovative office designs.
- Asia Pacific: Led by Japan, Australia, New Zealand for seismic-resistant wood buildings; China focuses on bamboo integration to reduce costs.
- Rest of World: Nascent market with growing adoption prospects.
Cross Laminated Timber Market Trends
Availability of Regional Wood as Raw Material to Attract Manufacturers for R&D of New Variants
Traditionally, cross laminated timber was manufactured using local raw material, hardwood from coniferous trees, available in the alpine region. But, with increasing popularity in other parts of the world, companies are experimenting with soft and temperate wood species for the manufacturing of the material. In North America, softwood is available in plenty and thus substitution of conventional hardwood is inevitable in the region. China, on the other hand, is researching the usage of bamboo in the alternate layers to increase the share of the local raw material utilized in the product. Such new developments may lead to improved performance of the material and are projected to increase the adoption of CLT over conventional construction material in these regions.
Download Free sample to learn more about this report.
Cross Laminated Timber Market Growth Factors
Rising Demand for Environment-Friendly Construction Materials to Drive Industry Growth
The increasing demand for cross laminated timber, an environmentally sustainable construction material, is due to increasing consumer awareness regarding damages caused to the environment during the manufacturing process of cement and bricks. Thus, consumers and technicians are shifting their focus on the usage of sustainable materials such as wood in the construction of buildings and other infrastructure. As CLT is manufactured using wood, many governments also support its usage in construction and provide monetary and space-liberty benefits to the user. For instance, in 2020, India’s Public Works Department removed the ban on timber in construction of buildings and habitat projects to spur local economy. Furthermore, the timber also shows better thermal and acoustic insulation as compared to conventional construction materials and thus reduces the usage of detrimental materials such as glass wool and foamed plastics for building insulation. Thus, the environmental benefits provided by the material has been a vital reason for its adoption in the construction industry.
Growth in the Construction Industry to Drive the Market Growth
The growth in the construction industry can significantly drive the cross-laminated timber market in several ways. As construction activity increases, there is a greater demand for sustainable building materials such as cross laminated timber due to its eco-friendly properties and versatility. CLT’s lightweight and strong characteristics make it an attractive alternative to traditional materials such as concrete and steel, especially in projects where speed and efficiency are crucial.
Moreover, as regulations increasingly emphasize environment-friendly construction practices and materials, the product demand is likely to surge. This demand is further fueled by the rising awareness of the need to reduce carbon emissions associated with construction activities.
Additionally, technological advancements and innovation in CLT manufacturing processes have made the product more cost-effective and scalable, making it a viable option for large-scale construction projects. As a result, the growth in the construction industry drives the product demand and also stimulates investment in research and development, further enhancing market potential. Overall, the symbiotic relationship between the construction industry and the market highlights the crucial role of boosting the demand for sustainable building materials in driving cross laminated timber market growth.
RESTRAINING FACTORS
Mediocre Fire and Moisture Resistance Impeding the Adoption of Cross Laminated Timber
Cross laminated timber being a wood-based material, has similar disadvantages like mediocre performance against fire and moisture. While many companies claim that the wood can burn up to 2 hours in case of fire, showing good fire-proof capability, it doesn’t match the performance of conventional building materials. Furthermore, the wood-based material is susceptible to damage caused by moisture. Accumulation of water in walls, floors, and edifices may lead to the formation of mold and bacteria, which may prove to be detrimental to the infrastructure. Thus, these factors are critical in decelerating market growth.
Cross Laminated Timber Market Segmentation Analysis
By Bonding Technology Analysis
To know how our report can help streamline your business, Speak to Analyst
Adhesive Bonded CLT to Hold Dominant Market Share Owing to its Significantly Lower Cost
Based on bonding technology, the market is classified into adhesive bonded, and mechanically fastened. The adhesive bonded segment is expected to account for 85.44% of the market in 2026. The strength of the wooden-based material is dependent on how strong the adjacent layers are attached. As adhesives provide higher bond strength and are less affected by environmental conditions as compared to mechanical fasteners, adhesive bonded material is utilized on a dominant scale in the market. Another vital reason for the dominance of adhesive bonded segment in the market is that adhesives cost significantly lower than the mechanical fasteners which lower the cost of manufacture of adhesive bonded CLT as compared to mechanically fastened timber material.
Despite all the above-mentioned disadvantages, mechanically fastened segment is gaining market share owing to environmental concerns regarding the usage of adhesives, that are manufactured using petrochemicals and other harmful materials. Furthermore, mechanically fastened timber is easier to be customized, which provides a novel pathway for its growth in the global market.
By Application Analysis
Large Adoption of CLT in Commercial Construction Expanding the Market Share of Non-Residential Buildings Segment
In terms of application, the market is segmented into residential buildings, non-residential buildings, and others. Non-residential buildings application holds the largest share expected for 60.89% globally in 2026 on account of large scale application of CLT in construction of office buildings in North America and Asia Pacific. The usage of CLT in commercial construction in Europe is also expanding, which further results in the growth of the non-residential buildings segment.
On the flipside, residential buildings segment is expected to give stiff competition to the non-residential segment on account of large scale consumption of this type of timber for construction of multi-family buildings in developing regions. Furthermore, in Europe, CLT is majorly used in residential buildings as they provide excellent thermal insulation performance, which has resulted in the growth of residential segment in the global market.
REGIONAL INSIGHTS
Europe Cross Laminated Timber Market Size, 2025 (USD Billion)
To get more information on the regional analysis of this market, Download Free sample
Europe
The North America market accounted for USD 0.43 billion in 2025, representing 31.60% of the global industry, and is expected to reach USD 0.52 billion in 2026. Europe is expected to lead the market owing to the large adoption of the material in the building of small and medium-sized houses in the region. Europe accounts for 65% of the global timber based wood material production and the majority of the product is used locally as Xlam provides better insulation performance against the cold temperatures usually present in the region. The UK market is valued at USD 0.082 billion by 2026, while the Germany market is valued at USD 0.077 billion by 2026.
North America
The North America market accounted for USD 0.43 billion in 2025, representing 31.60% of the global industry, and is expected to reach USD 0.52 billion in 2026. On the flipside, the market in North America is governed by the adoption of CLT in the construction of hybrid buildings that utilize a combination of timber and conventional materials to create artistic building design for office spaces. The U.S. market is valued at USD 0.374 billion by 2026.
Asia Pacific
In 2025, Asia Pacific represented USD 0.18 billion, accounting for 13.10% of the worldwide market, and is projected to grow to USD 0.21 billion in 2026. The market in Asia Pacific will be led by demand from Japan and Australia & New Zealand, wherein it is utilized for construction of wood-based buildings with enhanced seismic performance characteristics. The market in China is expected to expand owing to research being carried out to include locally grown bamboo into the product’s manufacturing, which shall reduce the costing of the product, making it affordable comparable to conventional building materials. The Japan market is valued at USD 0.096 billion by 2026, the China market is valued at USD 0.012 billion by 2026, and the India market is valued at USD 0.004 billion by 2026.
The market in Rest of World is in the nascent stage yet and thus shall gain market share in the near future as the adoption of the timber material increases in the region.
To know how our report can help streamline your business, Speak to Analyst
List of Key Companies in Cross Laminated Timber Market
Key Market Players Are Focusing to Improve Their Production Capacities
Competitive landscape of this market depicts a highly consolidated market with the top 5 companies accounting for a majority share in the market. Key players in the market are investing a large number of resources in research and development of CLT grades and applications. Companies are carrying out research to develop Xlam from lumber obtained from trees and plants such as bamboo, along with improving their performance against temperature fluctuations and acoustic variation as a course-way to gain market share.
Furthermore, key players operating in the market have adopted the strategy of capacity expansion to improve their turnaround time and serve their customers faster. This trend is projected to positively impact the global market during the forecast period.
LIST OF KEY COMPANIES PROFILED
- Stora Enso (Finland)
- Mayr Melnhof Holz Holding AG (Austria)
- Binderholz GmbH (Austria)
- Xlam Ltd. (Australia & New Zealand)
- Sterling Company (USA)
- Schilliger Holz AG (Switzerland)
- KLH Massivholz GmbH (Austria)
- B&K Structures (U.K.)
- Eugen Decker Holzindustrie KG (Germany)
- Structurlam Mass Timber Corporation (Canada)
- Smartlam NA (U.S.)
- Freres Lumber Co. Inc. (U.S.)
- Katerra (U.S. & India)
- IB EWP Inc. (Canada)
- Nordic Structures (Canada)
- StructureCraft Builders Inc. (Canada)
- Mercer Mass Timber (Canada)
- PFS Corporation (U.S.)
KEY INDUSTRY DEVELOPMENTS
- June 2023: Mercer Mass Timber, a subsidiary of Mercer International Inc., announced the acquisition of Structurlam Mass Timber Corporation and its subsidiaries by Mercer International Inc. The move is anticipated to significantly increase the production capacity of Mercer Mass Timber and strengthen its position as a leading supplier of mass timber products.
- November 2020: Stora Enso, a leading timber manufacturer in Europe, received approval for production and delivery of CLT panels to the U.S. that comply with the International Building Code, North American CLT standard, ANSI/APA PRG 320-2019, Standard for Performance-Rated cross laminated timber. The changes in 2021 issue of the code allows the construction of building of up to 18 storey, paving the way for company’s products in mid-rise building construction sector.
- January 2020– Mayr Melnhof Holz Holding AG announced an investment of approximately USD 145 million to build a modern CLT manufacturing plant at Leoben, Austria. The new plant is planned to meet the growth strategy set by the company to strengthen its forward integration progress and solidify its position in the European timber industry.
REPORT COVERAGE
The global cross laminated timber market research report provides a detailed analysis of the market and focuses on key aspects such as leading companies, laminate bonding technologies, and leading applications of the cross-lam. Besides this, the report offers insights into the market trends and highlights key industry developments. In addition to the aforementioned factors, the report encompasses several factors that have contributed to the growth of the market over recent years.
Request for Customization to gain extensive market insights.
REPORT SCOPE AND SEGMENTATION
|
ATTRIBUTE |
DETAILS |
|
Study Period |
2021-2034 |
|
Base Year |
2025 |
|
Estimated Year |
2026 |
|
Forecast Period |
2026-2034 |
|
Historical Period |
2021-2024 |
|
Growth Rate |
CAGR of 14.40% during 2026-2034 |
|
Unit |
Volume (Thousand Cubic Meters); Value (USD Billion) |
|
Segmentation |
By Bonding Technology
|
|
By Application
|
|
|
By Geography
|
Frequently Asked Questions
Fortune Business Insights says that the global market size was USD 1.55 Billion in 2026 and is projected to reach USD 4.63 Billion by 2034.
Growing at a CAGR of 14.40%, the market will exhibit rapid growth over the forecast period.
Non-residential buildings segment is the leading application in the market.
Rising demand for environment-friendly construction materials shall be the key driving factor for the growth of the market.
Europe held the highest market share in 2025.
Environment-friendly nature of the raw material coupled with excellent insulation and seismic performance as compared to conventional building products shall be the key factors driving the adoption of CLT.


- 2021-2034
- 2025
- 2021-2024
- 170
Get 30-60 hrs Free Customization
Expand Regional and Country Coverage, Segments Analysis, Company Profiles, Competitive Benchmarking, and End-user Insights.
Related Reports
-
US +1 833 909 2966 ( Toll Free )
-
Get In Touch With Us