Data Visualization Market Size, Share and Industry Analysis, By Component (Software, Services), By Solution (Standalone Visualization Software, Embedded Data Visualization Module), By Enterprise Size (Small Enterprises, Medium Enterprises, and Large Enterprises), By Industry (BFSI, Construction and Real Estate, Consumer Goods, Education, Government, Healthcare and Pharmaceuticals, Information Technology, Services) and Geography Forecast, 2026-2034
Data Visualization Tools Market Size and Industry Overview
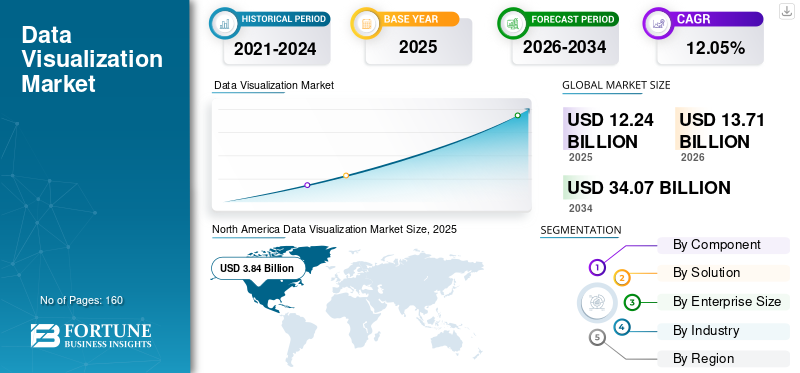
The global data visualization market size was valued at USD 12.24 billion in 2025. The market is projected to grow from USD 13.71 billion in 2026 to USD 34.07 billion by 2034, exhibiting a CAGR of 12.05% during the forecast period. North America dominated the global market with a share of 43.39% in 2025.
The market growth is primarily driven by the rising emphasis of enterprises and businesses on information visualization, visual analytics, and scientific visualization. This has led businessmen to invest in visualization tools and engage in joint ventures with prominent players of the market. For instance, in August 2019, Salesforce.com, Inc. acquired Tableau Software, LLC to enhance their analytical capabilities and deliver artificial intelligence (AI)-driven insights to their customers. With current COVID-19 pandemic, several enterprises and companies adopting this software for adequate visualization and tracking of the pandemic spread and analysis. However, with the growing economic and social disruption due to this pandemic, the market is anticipated to witness limited investments and expenditure which, in turn, is expected to impede the adoption of this software.
Download Free sample to learn more about this report.
Data Visualization Market Key Takeaways
- 2025 Market Size: USD 12.24 Billion
- 2026 Market Size: USD 13.71 Billion
- 2034 Forecast Market Size: USD 34.07 Billion
- CAGR: 12.05% from 2026–2034
- North America dominated the data visualization market with a 43.39% share in 2025.
- The software segment accounted for the largest market share in 2025.
- The cloud-based deployment segment held the leading market share in 2025.
Asia Pacific
Asia Pacific is expected to register the fastest growth due to rapid cloud adoption and expanding business intelligence investments.
North America
North America led the global data visualization market in 2025, driven by widespread adoption of advanced analytics technologies.
Europe
Europe is witnessing steady market growth, supported by increasing digital transformation initiatives across industries.
U.S.
Strong demand for AI-powered analytics and enterprise business intelligence solutions continues to drive market growth.
Japan
Rising investments in digital transformation and data-driven decision-making are supporting the adoption of data visualization solutions.
Read More
Data Visualization Market TRENDS
Growing Acceptance of Visualization Platforms for Predictive Analysis and Software Advisory Services
Software vendors are focusing on providing visualization tools inclusive of real-time analytics, which can be used for predictive analysis. With this feature, companies are emphasizing on accessing the latest information such as sales data for informed decision making and building better marketing strategies. Moreover, predictive analytics-enabled visualization platforms also help to create projections based on real-time data opted from visual data discovery tools. Similarly, visualization platform enables business executives and representatives to gain insights from a large amount of unstructured data. This helps executives and representatives to deliver best-suitable and efficient software advisory services to their customers. With all these features and capabilities, predictive analytics-enabled visualization tools are currently trending in the market.
Download Free sample to learn more about this report.
Identification of Business and Operational Patterns will Boost Business Performance
Visualization platforms allow users to grasp information and insights from a large amount of data with ease. These platforms also help decision-makers to identify the co-relation between multi-dimensional data sets and offer effective features and tools to interpret the data. Additionally, several industries such as information technology, services and telecommunications, research and retail, and E-commerce, among others, are adopting these tools to identify the sales and customer buying patterns. This will help to gather insights such as key performance metrics from their historical data. At present, companies are using these patterns and insights to compare the performance of current business operations and forecast future performance.
DRIVING FACTORS
Increasing Demand for Advance Visualization Technology by Enterprises to Bode Well for Market
In the past few years, the amount of data generated through various technologies such as the internet of things (IoT) and other data sources is increasing exponentially. This massive data pool includes both structured and unstructured data. Companies are preferring business intelligence software with advanced technologies such as artificial intelligence (AI) to handle huge amounts of data and generate a better and knowledgeable interpretation of statistics.
Furthermore, visualization platforms also offer a significant level of personalization and details to interpret complex data. For instance, in September 2019, Deloitte Touche Tohmatsu Ltd., one of the major players in the advisory services sector launched an advanced public data visualization tool which provides insights based on coding algorithms, visualization techniques and refines the same with artificial intelligence (AI), machine learning (ML), blockchain and big data analytics among others. The integration of such advanced technologies is supplementing the market growth.
Rising Investments in Visualization Platforms and Company Collaborations to Aid in Expansion of Market Growth
Considering the future opportunities associated with data and its representation, several companies are investing in enhancing their analytics and visualization capabilities with continuous investments in research and development. Additionally, companies are also focusing on acquiring visualization platform vendors to extend their portfolio and strengthen their analytics and business, intelligence division. For instance, in June 2019, Alphabet, Inc. announced that Google LLC is planning to acquire an analytics software company Looker Data Sciences, Inc., for an estimated USD 2.60 billion. With this acquisition, Google LLC will be able to provide an end-to-end analytics platform to connect, collect, analyze and visualize data across multiple platforms such as Azure, Google Cloud, on-premise databases, ISV applications and AWS. The growing investments in the field of visualization and major acquisitions of the companies are projected to contribute to the growth of the market in the coming years.
RESTRAINING FACTORS
High Cost and Security Issues to Cause Hindrance to Market Growth
The cost associated with visualization tools and platforms is high due to which it becomes difficult for small and medium enterprises to adopt this software. Additionally, the inflexible cost is offered by some of the companies due to which businesses are unwilling to purchase complete licenses inclusive of all features. Moreover, the complexity of other support services such as deployment, implementation, maintenance and staff training has also become costly for the companies. Similarly, the lack of centralized data security associated with visualization platforms is also a major barrier for the wide-scale adoption of data visualization tools. All these factors are anticipated to hamper this market in the forecast period.
Moreover, with uncertainty of the lockdown period due to COVID-19 pandemic across the countries and closure of the businesses, companies are expected to emphasize on the cost saving and reduce the spending on the software. This is also expected to affect the data visualization market growth in the short-term period.
SEGMENTATION ANALYSIS
By Component Analysis
Software Segment to Dominate Market Owing to Increase Demand for Enhanced Interpretation of Data
By component, the market is categorized into software and services. The software segment is further sub-segmented into a cloud services and on-premise deployment model while, the services segment is bifurcated into consulting services and support services. Among these segments, the software segment is projected to cover more than half of the market share throughout the forecast period. This is likely due to the rising adoption of business intelligence software for enhanced interpretation of data and to attain knowledgeable insights among enterprises across the world. For instance, in July 2019, University Hospitals of Morecambe Bay NHS Foundation Trust (UHMBT) based in the U.K. partnered with QlikTech International AB. They implemented an advanced analytics solution to emphasize patient care and enhance the efficiency of patients on a daily basis.
Apart from these, support and consulting services are projected to grow at a healthy CAGR during the forecast period owing to the increasing adoption of visualization software and platforms.
By Solution Analysis
Standalone Visualization Software to Experience Healthy CAGR During Forecast Period
Based on solution, the market is classified into standalone software and embedded module. Embedded module covers visualization APIs and plug-ins offered with the software. These modules are often provided with business intelligence software and solutions. The embedded module segment is estimated to witness considerable growth opportunities during the forecast period. Embedded modules are often preferred by companies due to the high cost associated with standalone software. However, the standalone segment is projected to grow at a substantial CAGR from 2020 to 2027. This is attributed to the increasing number of companies switching from embedded visualization modules to standalone software.
By Enterprise Size Analysis
Large Enterprises Segment to Contribute Significant Revenues to Boost Adoption of Visualization Tools and Platforms
On the basis of enterprise size, the market is categorized into small enterprises, medium enterprises, and large enterprises. Among these, the large enterprises segment is projected to dominate the market during the forecast period. The high adoption of visualization platforms among large enterprises is primarily propelling the growth of the market. Whereas, the medium enterprises segment is anticipated to witness prominent growth opportunity in terms of revenue during the forecast period. This is owing to the growing focus on information visualization and visual analytics.
By Industry Analysis
To know how our report can help streamline your business, Speak to Analyst
Information Technology, Services, and Telecommunications and Research Segments Leading the Market
Global data visualization market based on industry includes banking, financial services and insurance (BFSI sector), construction and real estate, consumer goods, education, government, healthcare and pharmaceuticals, information technology, services and telecommunications, research, retail and e-commerce, transportation and logistics, others such as environmental services, non-profit organization management, etc. Among these, the Information technology, services and telecommunications and research segments are projected to dominate the market for data visualization throughout the forecast period, eventually leading the global market. Moreover, the retail and e-commerce segment is expected to grow at the highest rate among the other industries. This is the result of the increasing data generation and demand for visualization tools to easily capture the key insights, data visualization market trends, patterns and forecast future consumer demand. Additionally, the BFSI, government and education segments are estimated to witness considerable growth opportunities during the forecast period.
REGIONAL ANALYSIS
North America Data Visualization Market Size, 2025 (USD Billion)
To get more information on the regional analysis of this market, Download Free sample
Geographically, the market is segmented into five major regions, namely North America, Europe, Asia Pacific, the Middle East & Africa, and Latin America. They are further categorized into countries.
North America
The North America Data Visualization Market size was valued at USD 3.84 Billion in 2019 and is growing at a CAGR of 9.3% from 2020 to 2027. North America is expected to be the leading region in terms of data visualization market share throughout the forecast period. The strong presence of companies and high penetration of visualization tools among various industries is contributing to the growth of the North America market. Additionally, the high expenditure of enterprises on analytics and business intelligence is likely to further boost the growth of this region. Europe is projected to grow at a substantial CAGR during the forecast period owing to the growing demand for information visualization and analytics among the retail and e-commerce as well as the transportation and logistics industries.
Asia Pacific
As per our market research study, Asia Pacific is experiencing strong adoption of visualization tools, specifically standalone visualization software. This increasing demand for visualization platforms in the Asia Pacific region is offering lucrative opportunities for software vendors. To leverage these opportunities, several visualization platform vendors are focusing on establishing their presence in the region through merger and acquisitions, company collaborations, and partnerships to extend their customer base. Such developments and investments by the companies are boosting the growth of Asia Pacific market. Similarly, the Middle East and Africa and Latin America regions are projected to witness a healthy growth rate during the forecast period, primarily due to the growing presence of visualization software vendors and their customized offerings.
KEY INDUSTRY PLAYERS
Key Players to Magnify Product Portfolio through Partnerships, Mergers, and Acquisitions
Major companies in the market are emphasizing on expanding their geographical presence through collaboration and partnerships to strengthen their market position. Similarly, companies are also acquiring startup companies and SMEs to offer innovative and advanced technology solutions such as predictive analytics, artificial intelligence (AI), and natural language processing (NLP). This will help them extend their product offering and deliver enhanced tools and solutions to their customers.
Furthermore, several companies are investing heavily in research and development to enhance their product portfolio and extend the features and capabilities of the products. These investments and developments by the companies are anticipated to introduce advance technology-enabled products in the market and move towards a highly competitive scenario. For instance;
QlikTech International AB is Emphasizing on Mergers and Collaborations to Extend Product Portfolio
QlikTech International AB has been focusing on delivering of the modern data analytics platforms to empower business and individuals to accelerate and transform businesses. The company is collaborating with multiple leading companies to integrate advance technologies in their offerings and enhance the efficiency and performance of their solutions.
- In January 2020, QlikTech International AB acquired RoxAI to enhance their product portfolio and enable their users to monitor and manage business data in real-time proactively
- In February 2019, QlikTech International AB partnered with DataRobot, Inc. to integrate automated machine-learning modelling directly into their platform to enable their users to attain predictive data decision-making
LIST OF KEY COMPANIES PROFILED:
- Adaptive Insights (Subsidiary of Workday, Inc.) (California, United States)
- Alteryx, Inc. (California, United States)
- ChartBlocks Ltd. (New York, United States)
- Cluvio GmbH (Berlin, Germany)
- Domo, Inc. (Utah, United States)
- Dundas Data Visualization, Inc. (Toronto, Canada)
- Highsoft AS (Sogn, Norway)
- IBM Corporation (New York, United States)
- Looker Data Sciences, Inc. (California, United States)
- Microsoft Corporation (Washington, United States)
- QlikTech International AB (Pennsylvania, United States)
- SAP SE (Walldorf, Germany)
- Sisense, Inc. (New York, United States)
- Tableau Software, LLC (California, United States)
- Visually, Inc. (California, United States)
KEY INDUSTRY DEVELOPMENTS:
- April 2020, Tableau Software, LLC collaborated with the U.S. Census Bureau and launched Response Rate Map which uses Tableau Public. This platform will help to mobilize participation, enhance customer experience and data transparency to the Census.
- November 2019 – Tableau Software, LLC expanded their strategic relationship with Amazon Web Services, Inc. (AWS) by announcing a new initiative “Modern Cloud Analytics (MCA)” which enables their customers to experience the flexibility of self-service analytics in cloud computing.
- July 2019 – Larsen & Toubro Infotech Ltd. (LTI) signed an agreement to acquire Lymbyc Solutions Pvt. Ltd. to strengthen LTI’s digital and analytics offerings and enhance their platform with deep learning, natural language processing (NLP), and visualization capabilities
FUTURE OUTLOOK
The increasing focus of companies on customer engagement and enhanced user experience is shifting towards the use of interactive and customized visualization of contents to gather insights, growth patterns and trends. Additionally, response time in decision making would also be a major factor which is reduced by business intelligence software and provides quick absorption of a high amount of data and fast access to the business insights. With such recompenses, the demand for visualization tools is expected to rise during the forecast period.
REPORT COVERAGE
The report offers qualitative and quantitative insights on visualization platforms and a detailed analysis of the market size & growth rate for all possible segments in the market in the form of press releases.
Request for Customization to gain extensive market insights.
Along with this, the report provides an elaborative analysis of the market dynamics, emerging trends, and the competitive landscape. Key insights offered in the report are the adoption trends of AI solutions by individual segments, recent industry developments such as partnerships, mergers & acquisitions, consolidated SWOT analysis of key players, Porter’s five forces analysis, business strategies of leading market players, macro and micro-economic indicators, and key industry trends.
REPORT SCOPE & SEGMENTATION
|
SEGMENTATION |
DETAILS |
|
Study Period |
2021 – 2034 |
|
Base Year |
2025 |
|
Forecast Period |
2026 – 2034 |
|
Historical Period |
2021 – 2024 |
|
Unit |
Value (USD billion) |
|
By Component |
|
|
By Solution |
|
|
By Enterprise Size |
|
|
By Industry |
|
|
By Region |
|
Frequently Asked Questions
The global data visualization market was worth USD 12.24 billion in 2025.
Data visualization tools are prominently used in information technology, services and telecommunications, research, retail & e-commerce, BFSI, government, education, healthcare & pharmaceuticals, and transportation & logistics industries.
The global data visualization market size is about USD 12.24 billion in 2025.
The software segment is the leading segment in the data visualization market.
The key factor driving the market is the increasing demand for advanced data visualization technologies and data-driven decision-making among enterprises.
The top players in the data visualization market include Microsoft Corporation, IBM Corporation, SAP SE, Oracle Corporation, Salesforce, Inc., Tableau Software, LLC, QlikTech International AB, Sisense, Inc., SAS Institute Inc., and Domo, Inc..
North America is expected to hold the highest share in the data visualization market.
The current market trend is the increasing adoption of AI-driven, real-time, and cloud-based data visualization tools for predictive analytics and faster decision-making.


- 2021-2034
- 2025
- 2021-2024
- 160
Get 30-60 hrs Free Customization
Expand Regional and Country Coverage, Segments Analysis, Company Profiles, Competitive Benchmarking, and End-user Insights.
Related Reports
-
US +1 833 909 2966 ( Toll Free )
-
Get In Touch With Us