"Innovative Market Solutions to Help Businesses Make Informed Decisions"
Flat Glass Market Size, Share & Industry Analysis, By Type (Float, Sheet, and Rolled), By Product Type (Coated, Extra Clear, Laminated, Toughened, and Others), By Application (Architecture, Automotive, Solar Panels, and Others), and Regional Forecast, 2026-2034
Last Updated: June 08, 2026
| Format: PDF
| Report ID:
FBI102720
Thank you for your interest in the
"United States Medical Devices Market!"
To receive a sample report, please provide the following details:
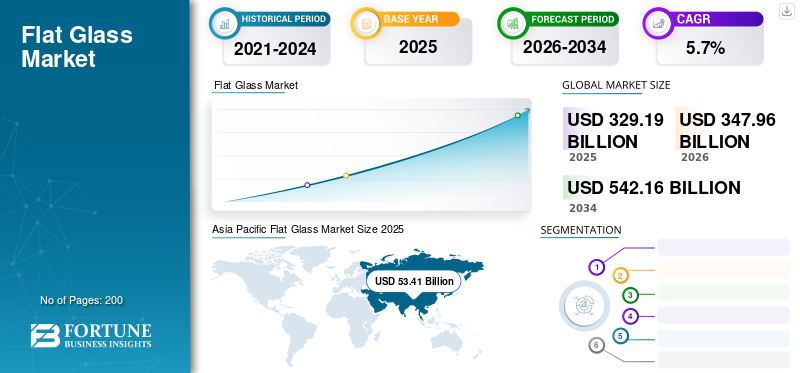
The global flat glass market size was valued at USD 329.19 billion in 2025. The market is projected to grow from USD 347.96 billion in 2026 to USD 542.16 billion by 2034, exhibiting a CAGR of 5.70% during the forecast period. Asia Pacific dominated the flat glass market with a market share of 54.3% in 2025. Moreover, the U.S. flat glass market is projected to reach USD 5.25 billion by 2026, driven by growth in automotive glazing and energy-efficient building solutions.
The global flat glass market is driven by sustained demand across construction, automotive, and renewable energy applications. In 2025, the market reflects growing investment in energy-efficient building materials, advanced glazing solutions, and lightweight automotive components. Industry participants increasingly prioritize performance, durability, and environmental compliance, reshaping production strategies and supply chains worldwide.
Rising urbanization and infrastructure development across emerging economies are major contributors to volume growth. Flat glass remains a foundational material in architectural applications, where demand is driven by residential construction, commercial real estate development, and public infrastructure projects. Increasing emphasis on green building standards has accelerated the adoption of coated, low-emissivity, and solar-control glass variants, strengthening long-term market fundamentals.
The automotive sector continues to represent a significant consumption base, particularly for tempered and laminated glass used in windshields, sunroofs, and advanced driver-assistance systems. Electrification trends and lightweighting initiatives are influencing material selection, pushing manufacturers toward thinner, stronger, and multifunctional glass solutions. Simultaneously, solar energy installations are sustaining demand for high-transparency flat glass, particularly in photovoltaic modules.
From a regional perspective, Asia-Pacific remains the largest production and consumption hub, supported by strong construction activity and expanding manufacturing capacity. Europe and North America continue to focus on energy-efficient building materials and circular manufacturing practices. Competitive intensity is rising as global producers invest in capacity expansion, digital process optimization, and sustainability-focused innovation.
Flat glass or plate glass is produced in the form of a plane and is commonly used for glass doors, windows, windscreens, and transparent walls. For applications in automotive and architecture, sometimes plate glass is bent after production to make it suitable for use. Most of the plate glass produced is soda-lime glass, using the float process. This type of glass has a higher content of magnesium oxide and sodium oxide as compared to container glass, and a lower content of calcium oxide, silica, and aluminum oxide.
In buildings, this glass not only provides shielding from UV radiation but also offers acoustic and thermal insulation. The benefits of the use of this glass in buildings also include energy efficiency through the maximum use of natural light. Governments set up regulations regarding green buildings that have encouraged demand. Moreover, the use of this glass in solar panels is increasing due to its properties, including high strength, low reflection, and high transmissibility. The need to harness energy from renewable sources has forced governments to invest in solar energy plants, thereby growing the market for flat glass.
Use of Flat Glass to make Buildings Energy Efficient to Drive the Market Demand
The rising awareness of saving electricity has led to the use of products with low energy ratings and extensive use of available natural sources of energy. The use of this glass in residential and commercial buildings has allowed the use of natural light and reduced the cost and consumption of artificial light. Governments in different countries have set up rules and regulations to promote energy efficiency in the building sector.
The buildings that comply with these rules and regulations on energy-efficient buildings consume up to 40%-60% less energy as compared to traditional buildings, which don’t comply with them. This has increased the consumption of this type of glass, thus leading to the growth rate of the market. Asia Pacific witnessed a growth from USD 50.66 billion in 2017 to USD 53.41 billion in 2018.
Several structural trends are reshaping the flat glass market. Energy-efficient glazing remains a central focus, with rising adoption of low-emissivity and solar-control glass in commercial and residential buildings. These products align with evolving building codes and sustainability certifications, reinforcing long-term demand.
Another notable trend is the integration of smart and functional glass technologies. Electrochromic and thermochromic glass solutions are gaining attention for their ability to regulate light transmission and thermal performance dynamically. While adoption remains concentrated in premium applications, costs are gradually declining.
The automotive sector continues to influence material innovation, particularly through lightweight glazing and acoustic insulation technologies. As electric vehicles gain market share, manufacturers increasingly prioritize weight reduction and thermal efficiency.
Digitalization is also reshaping manufacturing operations. Producers are investing in automation, advanced process control, and data analytics to improve yield and reduce waste. Sustainability initiatives, including recycling of glass cullet and reduced carbon emissions, are becoming central to long-term competitiveness.
Market Drivers
Growth in Construction & Infrastructural Activities to Drive the Progression of the Market
The growing construction activities and infrastructural development have led to a rise in demand. Flat Glass is utilized in roofs, windows, and facades. It is also used for internal partitions as an architectural feature. It provides excellent properties, including acoustic insulation and thermal insulation, to the building structures. These properties are creating a demand for different flat glass products in the building & construction industry. Additionally, rapid industrialization is encouraging the installation of this type of glass in commercial buildings for energy conservation by maximizing the use of natural light, and it is expected to drive the market.
The global flat glass market is primarily driven by sustained growth in construction, automotive manufacturing, and renewable energy deployment. Rapid urbanization across emerging economies has increased demand for architectural glass in residential and commercial infrastructure. Modern building designs increasingly rely on energy-efficient glazing to meet thermal performance and daylighting requirements, strengthening demand for coated and insulated glass solutions.
In the automotive sector, rising vehicle production and stricter safety regulations continue to support the use of laminated and tempered glass. Advanced driver-assistance systems and panoramic glazing designs further contribute to material demand. At the same time, expansion in solar energy installations has elevated the use of high-transparency flat glass in photovoltaic modules, particularly in utility-scale solar projects.
Industrial modernization also supports growth, as flat glass is integral to electronics, appliances, and industrial equipment. Technological advancements in float glass manufacturing and coating processes have improved yield, consistency, and optical performance. These improvements help manufacturers reduce operational costs while meeting stricter environmental standards. Combined, these drivers sustain steady demand across mature and emerging markets.
Market Restraints
Regulations by the Government on Carbon Emissions to Hamper Growth
A critical challenge hindering the growth of the flat glass market is the regulations imposed by the government on carbon emissions. The combustion of fuel oil or the decomposition of raw materials during the melting process is known to emit carbon dioxide. The release of harmful gases such as sulfur oxides and nitrous oxides during the decomposition of sulfur and nitrogen compounds contributes to the acidification and formation of smog, becoming a major factor in environmental pollution. Additionally, the evaporation of raw materials and molten glass releases particles in the atmosphere and is harmful to humans as well as animals. Hence, the above factors may inhibit the growth of the market.
Despite positive demand fundamentals, the flat glass market faces several structural constraints. Energy-intensive production processes expose manufacturers to volatile fuel and electricity costs, particularly in regions with limited access to stable energy supplies. Fluctuating raw material prices, including silica sand, soda ash, and limestone, also impact cost structures and pricing stability.
Environmental regulations present another challenge. Stringent emissions standards and decarbonization targets require substantial capital investment in cleaner production technologies. Smaller manufacturers often face difficulties meeting compliance requirements, limiting their ability to scale operations competitively.
Supply chain disruptions, including logistics bottlenecks and geopolitical uncertainties, can affect raw material availability and delivery schedules. These issues increase lead times and complicate inventory planning. Additionally, intense price competition in mature markets compresses margins, especially where product differentiation is limited.
Technological barriers also persist, particularly in developing advanced coatings and specialty glass with consistent quality. High capital expenditure requirements for furnace upgrades and digital manufacturing systems further restrain rapid capacity expansion, especially for mid-sized producers.
Market Opportunities
Significant growth opportunities exist across emerging economies where urban development and infrastructure investment remain strong. Rapid construction of residential complexes, commercial facilities, and transportation networks continues to create sustained demand for flat glass products.
The transition toward renewable energy offers another major opportunity. Expanding solar installations, particularly in Asia-Pacific and the Middle East, require high-quality glass with enhanced durability and optical performance. Manufacturers that invest in solar-grade glass technologies are positioned to capture long-term demand.
Technological innovation also presents opportunities for differentiation. Development of lightweight, high-strength glass for electric vehicles and advanced architectural applications can unlock premium market segments. Additionally, smart glass technologies aligned with energy efficiency and building automation trends offer strong growth potential.
From a strategic perspective, partnerships between glass producers, construction firms, and technology providers can accelerate product development and market access. Expanding recycling capabilities and circular manufacturing models further enhance sustainability credentials, supporting compliance with evolving environmental regulations and improving long-term competitiveness.
FLAT GLASS MARKET SEGMENTATION ANALYSIS
By Type Analysis
Float Glass Segment to Gain Impetus during the Forecast Period
Based on type, this market is classified into float, sheet, and rolled.
Float glass remains the dominant segment, accounting for the largest revenue share due to its superior optical clarity, uniform thickness, and scalability in mass production. Its widespread adoption in construction, automotive glazing, and solar applications reinforces its leadership position. Continuous improvements in float line efficiency and coating technologies further strengthen demand.
Float glass undergoes further processing such as lamination, coating, and heat treatment to make it suitable for architectural and automotive applications. Float glass coated with metal oxide coating has a high demand from the construction industry for use in residential and commercial buildings. The demand is due to the properties provided by coated glasses, such as glare control, low solar heat gain, blocking UV radiation, and they also offer customization and flexibility. The increasing demand for float glass owing to its properties shall lead to the growth of the floating segment during the forecast period, thereby driving the market. By type, the float segment is expected to hold a 90% share in 2025.
On the other hand, the sheet glass segment is expected to exhibit demand in the market due to its features, such as high-grade smooth finish, transparency, better flatness, and micro-roughness, thus showing significant growth in the market. Sheet glass continues to serve niche architectural and interior applications where cost sensitivity outweighs optical precision.
Its lower manufacturing complexity supports demand in price-sensitive markets, particularly in developing regions. Meanwhile, rolled glass finds use in patterned, textured, and specialty applications such as decorative partitions and solar thermal collectors. Ongoing innovation in surface design and light diffusion properties sustains its relevance in architectural and energy-focused projects.
By Product Type Analysis
To know how our report can help streamline your business, Speak to Analyst
Laminated Segment to Account for the Major Share during the Forecast Period
In terms of product type, this market is segmented into coated, extra clear, laminated, toughened glass, and others.
Amongst them, the laminated segment accounts for the major flat glass market share. Laminated glass remains intact when broken, thereby protecting it from injury. It also blocks the transmission of UV rays and the PVB layer, which is sandwiched between two layers of the glass and provides acoustic insulation. The rising demand for laminated glass from the construction and automotive industries, owing to its properties, is expected to increase the demand. Laminated glass, known for safety and acoustic insulation, continues to see strong uptake in automotive, commercial, and public infrastructure projects.
Coated glass represents a significant share, driven by rising demand for energy-efficient buildings. Low-emissivity and solar control coatings help regulate heat transfer, reduce energy consumption, and improve occupant comfort. These attributes align with stricter building codes and sustainability targets. The coated segment is expected to hold a 23.9% share in 2018.
Furthermore, the coated segment is showcasing growth due to its properties, such as enhanced insulation, anti-reflection, hydrophobic, and self-cleaning properties. Coated glass helps retain heat inside the building and improves solar gain, hence supporting the growth of the market.
Extra-clear glass is gaining traction in high-end architectural and photovoltaic applications where high light transmission is critical. Its low iron content enhances aesthetic appeal and performance, particularly in solar modules.
Toughened or tempered glass remains essential in applications requiring enhanced mechanical strength and thermal resistance. Its use in façades, automotive windows, and consumer electronics supports consistent demand. Other specialized products, including reflective and patterned glass, address niche design and functional requirements, reinforcing portfolio diversification across manufacturers. a
By Application Analysis
Architecture Segment to Maintain Strong Growth during the Forecast Period
Based on the application, this market is segmented into architecture, automotive, solar panels, and others.
Rising population, urbanization, and increasing disposable income are the few factors responsible for the rise in construction activities and infrastructural development around the world. In architectural applications, this type of glass is prominently used indoors, in windows, and in facades due to its properties such as acoustic insulation, heat insulation, anti-reflection, and transmission of selective solar wavelengths. Hence, the growth of the market can be attributed to the high demand from the construction industry.
Architecture represents the largest application segment, driven by global construction activity and evolving design preferences. High-rise buildings, commercial complexes, and institutional infrastructure increasingly rely on advanced glazing systems for energy efficiency and aesthetic value. Urban redevelopment projects further amplify demand for durable and visually appealing glass solutions.
Solar energy applications form a fast-growing segment. Flat glass is essential for photovoltaic panels, where transparency and durability directly affect energy conversion efficiency. Government incentives and renewable energy targets are accelerating installations worldwide.
Additional applications include appliances, electronics, and specialty industrial uses, where flat glass offers functional and aesthetic advantages. Together, these diverse end-use segments ensure balanced demand and long-term stability for the flat glass market.
The automotive segment continues to expand as manufacturers integrate advanced glazing for safety, comfort, and energy efficiency. Laminated windshields, panoramic roofs, and acoustic glazing support vehicle electrification and enhanced passenger experience. As electric vehicle adoption accelerates, the need for lightweight and thermally efficient glass materials grows.
Additionally, the growing demand from the automotive industry is further fueling the demand globally. This type of glass is used in windshields and mirrors, and also on rooftops for aesthetic appeal. Increased consumer spending on automobiles contributes to the growth of the automotive industry, thereby increasing the demand.
The flat glass market revenue in the Asia Pacific stood at USD 53.41 billion in 2018. The Asia Pacific is the largest and fastest-growing region in the market, owing to the investments by governments for construction activities and infrastructural development. Moreover, China is the largest contributor to the demand, which shall further drive the growth of the market. The flat glass market in Japan is expected to reach USD 7.8 billion by 2025. China is projected to witness a strong CAGR of 5.70% during the forecast period.
Asia-Pacific represents the fastest-growing regional market, supported by rapid urbanization, infrastructure expansion, and industrial growth. Large-scale construction activity across emerging economies, combined with rising automotive production, underpins strong demand for flat glass across multiple end-use sectors.
Japan Flat Glass Market
Japan’s flat glass market emphasizes technological precision and energy efficiency. Demand is driven by advanced manufacturing, automotive innovation, and smart building development. The market benefits from strong research capabilities and consistent investment in high-performance glazing materials for both domestic and export applications.
China Flat Glass Market
China dominates global flat glass production, supported by extensive manufacturing capacity and large-scale construction activity. Government-backed infrastructure programs and renewable energy investments continue to stimulate demand. The market also benefits from the increasing adoption of high-performance glass in commercial and residential developments.
North America Flat Glass Market Analysis
The market in North America is characterized by government regulations on energy-efficient buildings, thereby promoting this market. North America maintains a strong position in the flat glass market, supported by sustained construction activity, automotive production, and energy-efficient renovation programs. Demand is driven by commercial infrastructure upgrades and green building standards. The region benefits from advanced manufacturing capabilities, stable supply chains, and strong adoption of high-performance glazing technologies.
United States Flat Glass Market
The United States represents the largest contributor within North America, supported by robust residential construction and large-scale infrastructure investments. Growing adoption of energy-efficient glazing in commercial buildings and transportation applications drives steady demand. Technological innovation, combined with regulatory emphasis on sustainability, continues to shape product development and market expansion.
Europe Flat Glass Market Analysis
The flat glass market in Europe is to be governed by the usage of this glass in automobiles. Europe, being the hub of major automotive companies, will experience a rise in demand. Europe is anticipated to grow at a CAGR of 6.2% during the forecast period.
The European flat glass market is shaped by strict energy-efficiency regulations and strong demand for sustainable building materials. Renovation of aging infrastructure and increasing use of advanced glazing in commercial architecture support steady growth. The region also benefits from a well-established manufacturing base and ongoing investments in low-carbon production technologies.
Germany Flat Glass Market
Germany remains a core hub for high-performance flat glass production, supported by advanced manufacturing capabilities and strong automotive demand. The country’s focus on energy-efficient construction and renewable integration drives the adoption of coated and laminated glass products. Research-driven innovation strengthens its competitive position within the European market.
United Kingdom Flat Glass Market
The United Kingdom’s flat glass market is influenced by urban redevelopment projects and sustainability-driven construction policies. Demand for high-performance glazing in residential and commercial buildings remains steady. Retrofit activity and energy efficiency mandates continue to support replacement demand, particularly for insulated and solar-control glass solutions.
Latin America Flat Glass Market Analysis
Latin America’s flat glass market shows steady growth, supported by infrastructure modernization and expanding urban housing projects. Brazil and Mexico lead regional demand, driven by construction and automotive manufacturing. Gradual adoption of energy-efficient building standards further supports long-term market development.
Middle East & Africa Flat Glass Market Analysis (60 words)
The Middle East and Africa market benefits from large-scale construction projects, particularly in the commercial and hospitality sectors. Infrastructure diversification and urban expansion support steady demand. Adoption of energy-efficient glazing is rising as governments prioritize sustainable building practices and climate-resilient infrastructure development.
The market is expected to show substantial growth during the forecast period. Investment by the countries of these regions to harness energy from renewable sources has led to increased consumption of flat glass for solar panels. Therefore, the market in these regions will exhibit significant growth during the forecast period.
Competitive Landscape
Key Players Are Blending Organic and Inorganic Growth Strategies to Maintain Their Dominance in the Flat Glass Market
The competitive landscape of this market depicts a consolidated market with the top 5 companies accounting for about 60% of the global production capacity. Key players in the market have invested a considerable amount of resources in the research and development of flat glass products. A diversified product portfolio, supported by superior operational efficiency and novel technology development, is the strategy used by the market leaders for their growth. The Nippon Sheet Glass company is doing well in all segments of the flat glass market.
The global flat glass market features a balanced mix of multinational manufacturers and specialized regional producers. Leading companies focus on scale, process optimization, and advanced material science to maintain cost efficiency and product differentiation. Major players invest heavily in float glass capacity expansion, energy-efficient coatings, and digital manufacturing systems to meet evolving architectural and automotive requirements.
Key multinational producers maintain vertically integrated operations, allowing tighter control over raw materials, processing, and distribution. This structure supports consistent quality and supply reliability, particularly for large construction and infrastructure projects. In parallel, regional manufacturers compete through customization, faster delivery cycles, and localized product portfolios aligned with building codes and climate conditions.
Strategic partnerships are common across the value chain. Collaborations between glass manufacturers, coating technology providers, and construction firms accelerate innovation in low-emissivity, solar control, and safety glazing solutions. Mergers and acquisitions remain selective, focused on geographic expansion, technology acquisition, and capacity consolidation rather than aggressive consolidation.
Innovation priorities include lightweight architectural glass, advanced tempering processes, and sustainable production technologies aimed at lowering energy intensity. Digitalization of manufacturing operations, including predictive maintenance and quality analytics, further strengthens operational efficiency. As demand for green buildings rises, suppliers that integrate performance, compliance, and lifecycle efficiency are gaining a competitive advantage across global markets.
LIST OF KEY COMPANIES PROFILED IN FLAT GLASS MARKET:
March 2024: Saint-Gobain launched an advanced low-carbon flat glass production line designed to reduce manufacturing emissions while maintaining optical performance standards for architectural and automotive applications.
June 2024: AGC Inc. expanded its coated glass portfolio with high-selectivity solar control products aimed at improving thermal efficiency in commercial building façades.
September 2024: Guardian Glass introduced next-generation tempered glass technology focused on enhanced durability and safety for high-rise and transportation applications.
January 2025: NSG Group Announced capacity expansion at its Asian manufacturing facilities to support rising regional demand for energy-efficient glazing and solar-integrated glass solutions.
March 2025: Şişecam Partnered with regional construction firms to supply advanced laminated and acoustic glass for large-scale urban development projects, strengthening its footprint in emerging markets.
REPORT COVERAGE
The flat glass market report provides a detailed analysis of the market and focuses on key aspects such as leading companies, product types, and leading applications of the product. Besides this, the report offers insights into the market trends and highlights key flat glass industry developments. In addition to the aforementioned factors, the report encompasses several factors that have contributed to the growth of the market over recent years.
Report Scope & Segmentation
ATTRIBUTE
DETAILS
Study Period
2021-2034
Base Year
2025
Forecast Period
2026-2034
Historical Period
2021-2034
Unit
Value (USD Billion) and Volume (Million Ton)
Segmentation
By Type
Float
Sheet
Rolled
By Product Type
Coated
Extra Clear
Laminated
Toughened
Others
By Application
Architecture
Automotive
Solar Panels
Others
By Geography
North America (U.S., Canada, and Mexico)
Europe (Germany, France, UK, Italy, Spain, Russia, and the Rest of Europe)
Asia Pacific (China, Japan, India, Southeast Asia, and the Rest of Asia Pacific)
South America (Brazil, Argentina, and the Rest of South America)
The Middle East & Africa (GCC, and Rest of the Middle East & Africa)
The global flat glass market size is valued at USD 347.96 billion in 2026, projected to reach USD 542.16 billion by 2034 at a CAGR of 5.70% during 2026–2034.