"Innovative Market Solutions to Help Businesses Make Informed Decisions"

Metalworking Fluids Market Size, Share & Industry Analysis, By Function (Neat Cutting Oils, Water Cutting Oils, Corrosion Preventive Oils and Others), By Type (Mineral, Synthetic and Bio-based), By Application (Construction, Electrical & Power, Agriculture, Automotive & transportation, Telecommunication and Healthcare), and by End-use Industry (Metal Fabrication, Transportation Equipment, Machinery and Others) and Regional Forecast, 2020-2027

Last Updated: April 08, 2024 | Format: PDF | Report ID: FBI101391


KEY MARKET INSIGHTS

Play Audio Listen to Audio Version

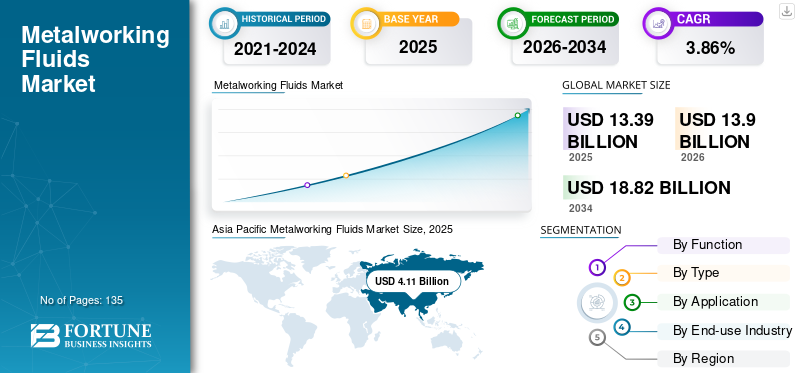
The global metalworking fluids market size was USD 10.25 billion in 2019 and it is projected to reach USD 11.60 billion by 2027, exhibiting a CAGR of 4.3% during the forecast period.


Metalworking fluids are used daily in several industries for operations such as milling, drilling, cutting, stamping, and grinding. Moreover, there is a constant change in the composition of these products due to the changing regulations, formulation, and also due to the pressure from regulatory bodies around the world.


Shut Down of Various Industries During Covid-19 Pandemic to Negatively Impact the Market


The strict measures taken to curb the spread of the coronavirus have affected several industries including automotive, building & construction, and production units of various manufacturing plants. For instance, in India, the effect of COVID-19 is so severe that the automotive industry is growing at a rate of -50% which is significantly less than in 2019. The pandemic has resulted in a huge supply-demand gap and it is directly affecting the production chain of the industries. Metalworking fluid is used in several industries for cutting, stamping, machining, grinding, and other different processes. Supply chain disruptions, labor unavailability, and a slowdown in logistics has reduced the demand for any industrial activity, in turn affecting the industries that are highly dependent on metalworking fluids. These factors are likely to hit the market globally.


LATEST TRENDS


Request a Free sample to learn more about this report.


Demand for Bio-based Fluids is Likely to rising Over the Forecast Period


Due to the restrictions imposed owing to ecological issues on human exposure of cutting fluids, meta removal fluids manufacturers, as well as consumers, are getting inclined towards bio-based products. It is fully biodegradable and renewable as its formulation is completely based on synthetic esters and vegetable oils. Moreover, they also fulfill the health and safety criteria set by various government bodies. Major players such as Shell, ExxonMobil, BP plc, and Total SA are already competing with their bio-based products. Now, bio-based fluids hold a low share but it is expected to expand in the upcoming years.


DRIVING FACTORS


Growing Demand from Automotive & Transportation Industry to Drive the Market


The recovery of the automotive sector, especially in the U.S.  post-recession, is expected to augment the growth of metalworking fluids over the forecast period. As per JP Morgan, the US auto industry is making a V-shape recovery which is likely to support the overall recovery of the market. Moreover, emerging economies such as India, China, Russia, and Brazil have witnessed significant growth in the automotive and transportation industries, especially manufacturing sectors. The increasing production of vehicles is the major factor influencing the demand for these products. Besides automotive industries, aerospace, railways, marine, and defense industries are also contributing to the growth.


Furthermore, these fluids continue to be used extensively in the machinery industry. The machine shop is the core of the manufacturing sector, as manufacturers not only focus on productivity and cost-cutting but also on the adoption of sustainable processes and technologies for long term business. The latest machinery industry includes machine shops that are buckling up for the manufacturing of customized specialty products which are expected to drive revenue growth in the coming years.


RESTRAINING FACTORS


Stringent Regulations on the Usage of Metalworking Fluids to Confine Market Growth


The major goal and intention of the government agencies is to protect the people, environment and workers from hazards, which are closely related to industrial manufacturing. Thus, there are many agencies working for minimizing the environmental hazards caused by these fluids. Some of the agencies working closely on this include EPA (Environmental Protection Agency), OSHA (Occupational Safety and Health Administration), NIOSH (The National Institute for Occupational Safety and Health) and OSH (Canadian Centre for Occupational Health and Safety). These agencies have imposed several stringent regulations that are restricting production.


SEGMENTATION


By Function Analysis


Neat Cutting Oils Segment to Generate the Highest Revenue During the Forecast Period


The neat cutting oils segment holds the largest metalworking fluids market share. Neat cutting oils are usually used for heavy-duty cutting gears such as tapping, broaching, hobbing, grinding, and drilling operations. They mainly act as lubricants, as fatty acids are mainly incorporated in it.


Water cutting oils segment holds a prominent share in the global market, as water is the best solution for cooling. Water is easily available and possesses the best heat-carrying capability. Unlike neat cutting fluids, water cutting oil does not possess lubrication properties and thus it can also lead to corrosion.


Corrosion prevention oils are an integral part of the market, as they are widely used for preventing rust formation and corrosion on workpieces, machine parts, machining tools, and metal tools. The chemical composition of corrosion prevention oils varies according to their chemical structure.


By Type Analysis


Synthetic Segment to Hold the Majority of Share


In terms of type, the market is segmented into mineral, synthetic, and bio-based. Mineral grade metalworking fluid is most commonly used as it is cost-effective than synthetic and bio-based fluids. Moreover, these fluids are predominantly used as a working fluid for lubricating and cooling purposes. Mineral oil generally consists of one or more refined mineral-based oil, together with pressure additives and anti-corrosion additives.


The synthetic segment holds the largest share in the global market. Synthetic fluids do not contain oil generated from petroleum. In synthetic oil, end-users mostly use detergent-like components and other types of additives to moisten the workpiece. Operations performed using synthetic and semi-synthetic oils are more pleasant to work with as the shop floors are less oily and slippery. Machines also stay cleaner as less dirt and oil are deposited on the surfaces.


The bio-based segment holds a smaller share in this market as the customers are not convinced using bio-based fluids. Moreover, its limitations such as inadequate availability and relatively high price are expected to affect the market for bio-based fluids and thus expected to grow at less CAGR.


By Application Analysis


Automotive & Transportation Segment to Exhibit a Significant Growth Rate


Automotive manufacturers extensively use metalworking fluids for the manufacturing of various automotive parts and equipment, and thus, the automotive & transportation segment holds the largest share in the metalworking fluid market. Further, they are closely connected to the automotive industry as large volumes of sheet metal and finished components are supplied to this industry. Other transportation industries such as marine and aerospace have several applications of these fluids for the manufacturing of their big parts or components.


The demand for these fluids for construction applications is increasing owing to the rise in building and construction activities. These fluids are extensively used in steel shaping and cutting processes. These products are also used in the manufacturing of construction equipment such as bulldozers and others. Thus, these products hold great significance in construction applications.


The other multiple applications include electrical & power, agriculture, telecommunication, and healthcare. Electrical & power also held a prominent share in the market due to the demand from applications such as gas & steam turbines, wind turbines, engines, and transformers.


By End-use Industry Analysis


To know how our report can help streamline your business, Speak to Analyst


Machinery Segment to Grow at an Impressive Rate


Metalworking fluids have major applications in the machinery segment. These fluids are majorly used in workshops for the forming and cutting of metals. The main purpose of the fluids is to cool the surface, lubricate tools, work-piece, and machinery. Several types of machinery operate in different industries such as automotive, electrical & power, construction and these fluids play an important role in overall manufacturing efficiency within these industries.


Metalworking fluids are used in the manufacturing of various transport equipment such as cranes, conveyors, trucks, and others. An increase in demand for transportation equipment due to rising construction activities is augmenting the demand for these products. Furthermore, they are also used in metal fabrication operations such as metal shaping, surface finishing, and surface preparation for industries such as furniture, domestic appliances, defense, and others.


REGIONAL INSIGHTS


Asia Pacific Metalworking Fluids Market Size, 2019 (USD Billion)

To get more information on the regional analysis of this market, Request a Free sample


Asia Pacific is anticipated to remain a key region in the market during the forecast period owing to the rising demand from the automotive & transportation industry. The market in this region holds the highest share owing to the robust manufacturing base in China and India. Strong support and initiatives taken by the governments of China and India for the manufacturing sector are aiding the dominance of the region in terms of the market share.


Emerging economies such as China and other Southeast Asian countries have witnessed significant growth in their manufacturing sectors. Growing consumption, coupled with favorable regulations, is likely to attract the market. Moreover, rise in demand from the automotive sector is expected to promote the demand in this region over the forecast period.


North America is one of the prime consumers and it also follows strict environmental protection policies imposed by EU Ecolabel, and OSHA. On the other hand, Europe is projected to witness significant growth in the global metalworking fluids market. Robust automotive manufacturing base in Germany and Russia is the key factor driving the market for metalworking in Europe.


Latin America and the Middle East & Africa would showcase lower growth in this market compared to the other regions owing to fewer manufacturing units and low demand due to less population in these regions.


KEY INDUSTRY PLAYERS


Market Players Such as Chevron Phillips Chemical and Exxon Mobil Corporation to Strengthen their Market Position with Novel Solutions


Several large-scale producers are located in Europe, but the demand is high from Asia Pacific leading to a fragmented market. The producers in North America and Europe are continuously engaged in mergers & acquisitions in order to strengthen their market position and to drive business growth. As a result, key players in the market have developed a strong regional presence, distribution channels, and product offerings.


LIST OF KEY COMPANIES PROFILED:


  • Houghton International Inc. (U.S.)

  • Castrol (UK)

  • Chevron Phillips Chemical (U.S.)

  • Exxon Mobil Corporation (U.S.)

  • Total S.A. (France)

  • Lubrizol (U.S.)

  • Quaker Chemical Corporation (U.S.)

  • Henkel (Germany)

  • Fuchs Petrolub SE (Germany)

  • BP plc. (UK)

  • Other


KEY INDUSTRY DEVELOPMENTS


  • October 2019: Master Fluid Solutions, a leading manufacturer in Perrysburg, Ohio, announced the acquisition of Wilhelm Dietz GmbH, a pipe and tube expansion, forming, wire drawing, and metalworking company based in Düsseldorf, Germany, to expand its global footprint and gain manufacturing capabilities in mainland Europe.

  • December 2018: The European Commission approved the acquisition of Global Houghton, Ltd., a provider of specialty chemicals, oils and lubricants headquartered in the U.S by Quaker Chemical Corporation, a producer of process fluids and specialty lubricants. This acquisition was done to expand its production and marketing of products in the new regions.


REPORT COVERAGE


An Infographic Representation of Metalworking Fluids Market

To get information on various segments, share your queries with us


The metalworking fluids market report includes a detailed analysis of the market and focuses on crucial aspects such as leading companies, function, application, types, end-use industry and distribution channels. Also, the report offers insights into market trends and highlights vital industry developments. In addition to the factors mentioned above, the report encompasses various factors that have contributed to the growth of the market over recent years.


Report Scope & Segmentation


 ATTRIBUTE


  DETAILS


Study Period


  2016-2027


Base Year


  2019


Forecast Period


  2020-2027


Historical Period


  2016-2018


Unit


  Value (USD Billion) and Volume (Kilo tons)


Segmentation


  Function, Type, Application, End-use Industry and Geography


By Function


  • Neat cutting oils

  • Water cutting oils

  • Corrosion preventive oils

  • Others


By Type


  • Mineral

  • Synthetic

  • Bio-based


By Application


  • Construction

  • Electrical & power

  • Agriculture

  • Automotive & transportation

  • Telecommunication

  • Healthcare


By End-use Industry


  • Metal Fabrication

  • Transportation Equipment

  • Machinery

  • Others


By Geography


  • North America

    • By Function

    • By Type

    • By Application

    • By End-use

    • By Country

      • U.S.

      • Canada


  • Europe

    • By Function

    • By Type

    • By Application

    • By End-use

    • By Country

      • Germany

      • UK

      • Italy

      • France

      • Russia

      • Rest of Europe


  • Asia Pacific

    • By Function

    • By Type

    • By Application

    • By End-use

    • By Country

      • China

      • India

      • Japan

      • ASEAN

      • Rest of Asia Pacific


  • Latin America

    • By Function

    • By Type

    • By Application

    • By End-use

    • By Country

      • Brazil

      • Mexico

      • Rest of Latin America


  • Middle East & Africa

    • By Function

    • By Type

    • By Application

    • By End-use

    • By Country

      • GCC

      • South Africa

      • Rest of Middle East & Africa


Frequently Asked Questions

Fortune Business Insights says that the market was USD 10.25 Billion in 2019 and is projected to reach USD 11.60 Billion by 2027.

The market will exhibit a steady growth at a CAGR of 4.3% in the forecast period (2020-2027).

Automotive & Transportation segment is expected to be the leading resin for the market during the forecast period.

Increasing demand from the automotive & transportation industry is driving the market growth.

Asia Pacific is expected to hold the highest share in the market.

The machinery industry would drive the adoption.

Rising demand from the automotive industry is expected to drive the market.

Seeking Comprehensive Intelligence on Different Markets?
Get in Touch with Our Experts

Speak to an Expert

Table of Content:

  1. Introduction
    1. Research Scope
    2. Market Segmentation
    3. Research Methodology
    4. Definitions and Assumptions
  2. Executive Summary
  3. Market Dynamics
    1. Market Drivers
    2. Market Restraints
    3. Market Opportunities
  4. Key Insights
    1. Key Industry Trends
    2. Overview of Global Metalworking Fluids Production
  5. Impact of COVID-19 on the Market
  6. Global Metalworking Fluids Market Analysis, Insights and Forecast, 2016-2027
    1. Key Findings / Summary
    2. Market Analysis, Insights and Forecast – By Function
      1. Neat Cutting Oils
      2. Water Cutting Oils
      3. Corrosion Protection Oils
      4. Others
    3. Market Analysis, Insights and Forecast – By Type
      1. Mineral
      2. Synthetic
      3. Bio-based
    4. Market Analysis, Insights and Forecast – By Application
      1. Construction
      2. Electrical & Power
      3. Agriculture
      4. Automotive & transportation
      5. Telecommunication
      6. Healthcare
    5. Market Analysis, Insights and Forecast – By End-use Industry
      1. Metal Fabrication
      2. Transportation Equipment
      3. Machinery
      4. Others
    6. Market Analysis, Insights and Forecast – By Region
      1. North America
      2. Europe
      3. Asia pacific
      4. Latin America
      5. Middle East & Africa
  7. North America Metalworking Fluids Market Analysis, Insights and Forecast, 2016-2027
    1. Key Findings / Summary
    2. Market Analysis, Insights and Forecast – By Function
      1. Neat Cutting Oils
      2. Water Cutting Oils
      3. Corrosion Protection Oils
      4. Others
    3. Market Analysis, Insights and Forecast – By Type
      1. Mineral
      2. Synthetic
      3. Bio-based
    4. Market Analysis, Insights and Forecast – By Application
      1. Construction
      2. Electrical & Power
      3. Agriculture
      4. Automotive & transportation
      5. Telecommunication
      6. Healthcare
    5. Market Analysis, Insights and Forecast – By End-use Industry
      1. Metal Fabrication
      2. Transportation Equipment
      3. Machinery
      4. Others
    6. Market Analysis – By Country
      1. U.S.
      2. Canada
  8. Europe Metalworking Fluids Market Analysis, Insights and Forecast, 2016-2027
    1. Key Findings / Summary
    2. Market Analysis, Insights and Forecast – By Function
      1. Neat Cutting Oils
      2. Water Cutting Oils
      3. Corrosion Protection Oils
      4. Others
    3. Market Analysis, Insights and Forecast – By Type
      1. Mineral
      2. Synthetic
      3. Bio-based
    4. Market Analysis, Insights and Forecast – By Application
      1. Construction
      2. Electrical & Power
      3. Agriculture
      4. Automotive & transportation
      5. Telecommunication
      6. Healthcare
    5. Market Analysis, Insights and Forecast – By End-use Industry
      1. Metal Fabrication
      2. Transportation Equipment
      3. Machinery
      4. Others
    6. Market Analysis – By Country
      1. Germany
      2. U.K.
      3. France
      4. Italy
      5. Russia
      6. Rest of Europe
  9. Asia Pacific Metalworking Fluids Market Analysis, Insights and Forecast, 2016-2027
    1. Key Findings / Summary
    2. Market Analysis, Insights and Forecast – By Function
      1. Neat Cutting Oils
      2. Water Cutting Oils
      3. Corrosion Protection Oils
      4. Others
    3. Market Analysis, Insights and Forecast – By Type
      1. Mineral
      2. Synthetic
      3. Bio-based
    4. Market Analysis, Insights and Forecast – By Application
      1. Construction
      2. Electrical & Power
      3. Agriculture
      4. Automotive & transportation
      5. Telecommunication
      6. Healthcare
    5. Market Analysis, Insights and Forecast – By End-use Industry
      1. Metal Fabrication
      2. Transportation Equipment
      3. Machinery
      4. Others
    6. Market Analysis – By Country
      1. China
      2. India
      3. Japan
      4. ASEAN
      5. Rest of Asia Pacific
  10. Latin America Market Analysis, Insights and Forecast, 2016-2027
    1. Key Findings / Summary
    2. Market Analysis, Insights and Forecast – By Function
      1. Neat Cutting Oils
      2. Water Cutting Oils
      3. Corrosion Protection Oils
      4. Others
    3. Market Analysis, Insights and Forecast – By Type
      1. Mineral
      2. Synthetic
      3. Bio-based
    4. Market Analysis, Insights and Forecast – By Application
      1. Construction
      2. Electrical & Power
      3. Agriculture
      4. Automotive & transportation
      5. Telecommunication
      6. Healthcare
    5. Market Analysis, Insights and Forecast – By End-use Industry
      1. Metal Fabrication
      2. Transportation Equipment
      3. Machinery
      4. Others
    6. Market Analysis – By Country
      1. Brazil
      2. Mexico
      3. Rest of Latin America
  11. Middle East & Africa Market Analysis, Insights and Forecast, 2016-2027
    1. Key Findings / Summary
    2. Market Analysis, Insights and Forecast – By Function
      1. Neat Cutting Oils
      2. Water Cutting Oils
      3. Corrosion Protection Oils
      4. Others
    3. Market Analysis, Insights and Forecast – By Type
      1. Mineral
      2. Synthetic
      3. Bio-based
    4. Market Analysis, Insights and Forecast – By Application
      1. Construction
      2. Electrical & Power
      3. Agriculture
      4. Automotive & transportation
      5. Telecommunication
      6. Healthcare
    5. Market Analysis, Insights and Forecast – By End-use Industry
      1. Metal Fabrication
      2. Transportation Equipment
      3. Machinery
      4. Others
    6. Market Analysis – By Country
      1. GCC
      2. South Africa
      3. Rest of Middle East & Africa
  12. Competitive Analysis
    1. Company Profiles (Overview, Products & services, SWOT analysis, Recent developments, strategies, financials (based on availability))
      1. Houghton International Inc.
        1. Overview,
        2. Products & services,
        3. SWOT analysis,
        4. Recent developments,
        5. strategies,
        6. financials (based on availability)
      2. Castrol
        1. Overview,
        2. Products & services,
        3. SWOT analysis,
        4. Recent developments,
        5. strategies,
        6. financials (based on availability)
      3. Chevron Phillips Chemical
        1. Overview,
        2. Products & services,
        3. SWOT analysis,
        4. Recent developments,
        5. strategies,
        6. financials (based on availability)
      4. Exxon Mobil Corporation
        1. Overview,
        2. Products & services,
        3. SWOT analysis,
        4. Recent developments,
        5. strategies,
        6. financials (based on availability)
      5. Total S.A.
        1. Overview,
        2. Products & services,
        3. SWOT analysis,
        4. Recent developments,
        5. strategies,
        6. financials (based on availability)
      6. Lubrizol
        1. Overview,
        2. Products & services,
        3. SWOT analysis,
        4. Recent developments,
        5. strategies,
        6. financials (based on availability)
      7. Quaker Chemical Corporation
        1. Overview,
        2. Products & services,
        3. SWOT analysis,
        4. Recent developments,
        5. strategies,
        6. financials (based on availability)
      8. Henkel
        1. Overview,
        2. Products & services,
        3. SWOT analysis,
        4. Recent developments,
        5. strategies,
        6. financials (based on availability)
      9. Fuchs Petrolub SE
        1. Overview,
        2. Products & services,
        3. SWOT analysis,
        4. Recent developments,
        5. strategies,
        6. financials (based on availability)
      10. BP p.l.c.
        1. Overview,
        2. Products & services,
        3. SWOT analysis,
        4. Recent developments,
        5. strategies,
        6. financials (based on availability)
      11. Other Key Players
        1. Overview,
        2. Products & services,
        3. SWOT analysis,
        4. Recent developments,
        5. strategies,
        6. financials (based on availability)
  13. Strategic Recommendations

List of Figures

Figure 01 Global Revenue Breakdown (US$ Bn, %) by Region, 2019 & 2027

Figure 02 Global Volume Breakdown (KT, %) by Region, 2019 & 2027

Figure 03 Global Metalworking Fluids Production

Figure 04 Global Revenue Share (%), by Function, 2019 & 2027

Figure 05 Global Volume Share (%), by Function, 2019 & 2027

Figure 06 Global Forecast (US$ Bn), by Neat Cutting Oils, 2016-2027

Figure 07 Global Forecast (KT), by Neat Cutting Oils, 2016-2027

Figure 08 Global Forecast (US$ Bn), by Water Cutting Oils, 2016-2027

Figure 09 Global Forecast (KT), by Water Cutting Oils, 2016-2027

Figure 10 Global Forecast (US$ Bn), by Corrosion Prevention Oils, 2016-2027

Figure 11 Global Forecast (KT), by Corrosion Prevention Oils, 2016-2027

Figure 12 Global Forecast (KT), by Others, 2016-2027

Figure 13 Global Forecast (KT), by Others, 2016-2027

Figure 14 Global Revenue Share (%), by Type, 2019 & 2027

Figure 15 Global Volume Share (%), by Type 2019 & 2027

Figure 16 Global Forecast (US$ Bn), by Mineral, 2016-2027

Figure 17 Global Forecast (KT), by Mineral, 2016-2027

Figure 18 Global Forecast (US$ Bn), by Synthetic, 2016-2027

Figure 19 Global Forecast (KT), by Synthetic, 2016-2027

Figure 20 Global Forecast (US$ Bn), by Bio-based, 2016-2027

Figure 21 Global Forecast (KT), by Bio-based, 2016-2027

Figure 22 Global Revenue Share (%), by Application, 2019 & 2027

Figure 23 Global Volume Share (%), by Application, 2019 & 2027

Figure 24 Global Forecast (US$ Bn), by Construction, 2016-2027

Figure 25 Global Forecast (KT), by Construction, 2016-2027

Figure 26 Global Forecast (US$ Bn), by Electrical & Power, 2016-2027

Figure 27 Global Forecast (KT), by Electrical & Power, 2016-2027

Figure 28 Global Forecast (US$ Bn), by Agriculture, 2016-2027

Figure 29 Global Forecast (KT), by Agriculture, 2016-2027

Figure 30 Global Forecast (US$ Bn), by Automotive & Transportation, 2016-2027

Figure 31 Global Forecast (KT), by Automotive & Transportation, 2016-2027

Figure 32 Global Forecast (US$ Bn), by Telecommunication, 2016-2027

Figure 33 Global Forecast (KT), by Telecommunication, 2016-2027

Figure 34 Global Forecast (US$ Bn), by Healthcare, 2016-2027

Figure 35 Global Forecast (KT), by End-use Industry, 2016-2027

Figure 36 Global Revenue Share (%), by End-use Industry, 2019 & 2027

Figure 37 Global Volume Share (%), by Metal Fabrication, 2019 & 2027

Figure 38 Global Forecast (US$ Bn), by Metal Fabrication, 2016-2027

Figure 39 Global Forecast (KT), by Transportation Equipment, 2016-2027

Figure 40 Global Forecast (US$ Bn), by Transportation Equipment, 2016-2027

Figure 41 Global Forecast (KT), by Machinery, 2016-2027

Figure 42 Global Forecast (US$ Bn), by Machinery, 2016-2027

Figure 43 Global Forecast (KT), by Others, 2016-2027

Figure 44 Global Forecast (US$ Bn), by Others, 2016-2027

Figure 45 Global Revenue Share (%), by Region, 2019 & 2027

Figure 46 Global Volume Share (%), by Region, 2019 & 2027

Figure 47 North America Revenue (US$ Bn), by Country, 2019 & 2027

Figure 48 North America Volume (KT), by Country, 2019 & 2027

Figure 49 North America Revenue Share (%), by Country, 2019

Figure 50 North America Volume Share (%), by Country, 2019

Figure 51 North America Revenue (US$ Bn), by Function, 2019 & 2027

Figure 52 North America Volume (KT), by Function, 2019 & 2027

Figure 53 North America Revenue Share (%), by Function, 2019

Figure 54 North America Volume Share (%), by Function, 2019

Figure 55 North America Revenue (US$ Bn), by Type, 2019 & 2027

Figure 56 North America Volume (KT), by Type, 2019 & 2027

Figure 57 North America Revenue Share (%), by Type, 2019

Figure 58 North America Volume Share (%), by Type, 2019

Figure 59 North America Revenue (US$ Bn), by Application, 2019 & 2027

Figure 60 North America Volume (KT), by Application, 2019 & 2027

Figure 61 North America Revenue Share (%), by Application, 2019

Figure 62 North America Volume Share (%), by Application, 2019

Figure 63 North America Revenue (US$ Bn), by End-use Industry, 2019 & 2027

Figure 64 North America Volume (KT), by End-use Industry, 2019 & 2027

Figure 65 North America Revenue Share (%), by End-use Industry, 2019

Figure 66 North America Volume Share (%), by End-use Industry, 2019

Figure 67 Europe Revenue (US$ Bn), by Country, 2019 & 2027

Figure 68 Europe Volume (KT), by Country, 2019 & 2027

Figure 69 Europe Revenue Share (%), by Country, 2019

Figure 70 Europe Volume Share (%), by Country, 2019

Figure 71 Europe Revenue (US$ Bn), by Function, 2019 & 2027

Figure 72 Europe Volume (KT), by Function, 2019 & 2027

Figure 73 Europe Revenue Share (%), by Function, 2019

Figure 74 Europe Volume Share (%), by Function, 2019

Figure 75 Europe Revenue (US$ Bn), by Type, 2019 & 2027

Figure 76 Europe Volume (KT), by Type, 2019 & 2027

Figure 77 Europe Revenue Share (%), by Type, 2019

Figure 78 Europe Volume Share (%), by Type, 2019

Figure 79 Europe Revenue (US$ Bn), by Application, 2019 & 2027

Figure 80 Europe Volume (KT), by Application, 2019 & 2027

Figure 81 Europe Revenue Share (%), by Application, 2019

Figure 82 Europe Volume Share (%), by Application, 2019

Figure 83 Europe Revenue (US$ Bn), by End-use Industry, 2019 & 2027

Figure 84 Europe Volume (KT), by End-use Industry, 2019 & 2027

Figure 85 Europe Revenue Share (%), by End-use Industry, 2019

Figure 86 Europe Volume Share (%), by End-use Industry, 2019

Figure 87 Asia Pacific Revenue (US$ Bn), by Country, 2019 & 2027

Figure 88 Asia Pacific Volume (KT), by Country, 2019 & 2027

Figure 89 Asia Pacific Revenue Share (%), by Country, 2019

Figure 90 Asia Pacific Volume Share (%), by Country, 2019

Figure 91 Asia Pacific Revenue (US$ Bn), by Function, 2019 & 2027

Figure 92 Asia Pacific Volume (KT), by Function, 2019 & 2027

Figure 93 Asia Pacific Revenue Share (%), by Function, 2019

Figure 94 Asia Pacific Volume Share (%), by Function, 2019

Figure 95 Asia Pacific Revenue (US$ Bn), by Type, 2019 & 2027

Figure 96 Asia Pacific Volume (KT), by Type, 2019 & 2027

Figure 97 Asia Pacific Revenue Share (%), by Type, 2019

Figure 98 Asia Pacific Volume Share (%), by Type, 2019

Figure 99 Asia Pacific Revenue (US$ Bn), by Application, 2019 & 2027

Figure 100 Asia Pacific Volume (KT), by Application, 2019 & 2027

Figure 101 Asia Pacific Revenue Share (%), by Application, 2019

Figure 102 Asia Pacific Volume Share (%), by Application, 2019

Figure 103 Asia Pacific Revenue (US$ Bn), by End-use Industry, 2019 & 2027

Figure 104 Asia Pacific Volume (KT), by End-use Industry, 2019 & 2027

Figure 105 Asia Pacific Revenue Share (%), by End-use Industry, 2019

Figure 106 Asia Pacific Volume Share (%), by End-use Industry, 2019

Figure 107 Latin America Revenue (US$ Bn), by Country, 2019 & 2027

Figure 108 Latin America Volume (KT), by Country, 2019 & 2027

Figure 109 Latin America Revenue Share (%), by Country, 2019

Figure 110 Latin America Volume Share (%), by Country, 2019

Figure 111 Latin America Revenue (US$ Bn), by Function, 2019 & 2027

Figure 112 Latin America Volume (KT), by Function, 2019 & 2027

Figure 113 Latin America Revenue Share (%), by Function, 2019

Figure 114 Latin America Volume Share (%), by Function, 2019

Figure 115 Latin America Revenue (US$ Bn), by Type, 2019 & 2027

Figure 116 Latin America Volume (KT), by Type, 2019 & 2027

Figure 117 Latin America Revenue Share (%), by Type, 2019

Figure 118 Latin America Volume Share (%), by Type, 2019

Figure 119 Latin America Revenue (US$ Bn), by Application, 2019 & 2027

Figure 120 Latin America Volume (KT), by Application, 2019 & 2027

Figure 121 Latin America Revenue Share (%), by Application, 2019

Figure 122 Latin America Volume Share (%), by Application, 2019

Figure 123 Latin America Revenue (US$ Bn), by End-use Industry, 2019 & 2027

Figure 124 Latin America Volume (KT), by End-use Industry, 2019 & 2027

Figure 125 Latin America Revenue Share (%), by End-use Industry, 2019

Figure 126 Latin America Volume Share (%), by End-use Industry, 2019

Figure 127 Middle East & Africa Revenue (US$ Bn), by Country, 2019 & 2027

Figure 128 Middle East & Africa Volume (KT), by Country, 2019 & 2027

Figure 129 Middle East & Africa Revenue Share (%), by Country, 2019

Figure 130 Middle East & Africa Volume Share (%), by Country, 2019

Figure 131 Middle East & Africa Revenue (US$ Bn), by Function, 2019 & 2027

Figure 132 Middle East & Africa Volume (KT), by Function, 2019 & 2027

Figure 133 Middle East & Africa Revenue Share (%), by Function, 2019

Figure 134 Middle East & Africa Volume Share (%), by Function, 2019

Figure 135 Middle East & Africa Revenue (US$ Bn), by Type, 2019 & 2027

Figure 136 Middle East & Africa Volume (KT), by Type, 2019 & 2027

Figure 137 Middle East & Africa Revenue Share (%), by Type, 2019

Figure 138 Middle East & Africa Volume Share (%), by  Type, 2019

Figure 139 Middle East & Africa Revenue (US$ Bn), by Application, 2019 & 2027

Figure 140 Middle East & Africa Volume (KT), by Application, 2019 & 2027

Figure 141 Middle East & Africa Revenue Share (%), by Application, 2019

Figure 142 Middle East & Africa Volume Share (%), by Application, 2019

Figure 143 Middle East & Africa Revenue (US$ Bn), by End-use Industry, 2019 & 2027

Figure 144 Middle East & Africa Volume (KT), by End-use Industry, 2019 & 2027

Figure 145 Middle East & Africa Revenue Share (%), by End-use Industry, 2019

Figure 146 Middle East & Africa Volume Share (%), by End-use Industry, 2019

List of Tables

Table 01 Global Revenue (US$ Bn) Forecast, by Function, 2016–2027

Table 02 Global Volume (KT) Forecast, by Function, 2016–2027

Table 03 Global Revenue (US$ Bn) Forecast, by Type, 2016–2027

Table 04 Global Volume (KT) Forecast, by Type, 2016–2027

Table 05 Global Revenue (US$ Bn) Forecast, by Application, 2016–2027

Table 06 Global Volume (KT) Forecast, by Application, 2016–2027

Table 07 Global Revenue (US$ Bn) Forecast, by End-use Industry, 2016–2027

Table 08 Global Volume (KT) Forecast, by End-use Industry, 2016–2027

Table 09 Global Revenue (US$ Bn) Forecast, by Region, 2016–2027

Table 10 Global Volume (KT) Forecast, by Region, 2016–2027

Table 11 North America Revenue (US$ Bn) Forecast, by Country, 2016–2027

Table 12 North America Volume (KT) Forecast, by Country, 2016–2027

Table 13 North America Revenue (US$ Bn) Forecast, by Function, 2016–2027

Table 14 North America Volume (KT) Forecast, by Function, 2016–2027

Table 15 North America Revenue (US$ Bn) Forecast, by Type, 2016–2027

Table 16 North America Volume (KT) Forecast, by Type, 2016–2027

Table 17 North America Revenue (US$ Bn) Forecast, by Application, 2016–2027

Table 18 North America Volume (KT) Forecast, by Application, 2016–2027

Table 19 North America Revenue (US$ Bn) Forecast, by End-use Industry, 2016–2027

Table 20 North America Volume (KT) Forecast, by End-use Industry, 2016–2027

Table 21 Europe Revenue (US$ Bn) Forecast, by Country, 2016–2027

Table 22 Europe Volume (KT) Forecast, by Country, 2016–2027

Table 23 Europe Revenue (US$ Bn) Forecast, by Function, 2016–2027

Table 24 Europe Volume (KT) Forecast, by Function, 2016–2027

Table 25 Europe Revenue (US$ Bn) Forecast, by Type, 2016–2027

Table 26 Europe Volume (KT) Forecast, by Type, 2016–2027

Table 27 Europe Revenue (US$ Bn) Forecast, by Application, 2016–2027

Table 28 Europe Volume (KT) Forecast, by Application, 2016–2027

Table 29 Europe Revenue (US$ Bn) Forecast, by End-use Industry, 2016–2027

Table 30 Europe Volume (KT) Forecast, by End-use Industry, 2016–2027

Table 31 Asia Pacific Revenue (US$ Bn) Forecast, by Country, 2016–2027

Table 32 Asia Pacific Volume (KT) Forecast, by Country, 2016–2027

Table 33 Asia Pacific Revenue (US$ Bn) Forecast, by Function, 2016–2027

Table 34 Asia Pacific Volume (KT) Forecast, by Function, 2016–2027

Table 35 Asia Pacific Revenue (US$ Bn) Forecast, by Type, 2016–2027

Table 36 Asia Pacific Volume (KT) Forecast, by Type, 2016–2027

Table 37 Asia Pacific Revenue (US$ Bn) Forecast, by Application, 2016–2027

Table 38 Asia Pacific Volume (KT) Forecast, by Application, 2016–2027

Table 39 Asia Pacific Revenue (US$ Bn) Forecast, by End-use Industry, 2016–2027

Table 40 Asia Pacific Volume (KT) Forecast, by End-use Industry, 2016–2027

Table 41 Latin America Revenue (US$ Bn) Forecast, by Country, 2016–2027

Table 42 Latin America Volume (KT) Forecast, by Country, 2016–2027

Table 43 Latin America Revenue (US$ Bn) Forecast, by Function, 2016–2027

Table 44 Latin America Volume (KT) Forecast, by Function, 2016–2027

Table 45 Latin America Revenue (US$ Bn) Forecast, by Type, 2016–2027

Table 46 Latin America Volume (KT) Forecast, by Type, 2016–2027

Table 47 Latin America Revenue (US$ Bn) Forecast, by Application, 2016–2027

Table 48 Latin America Volume (KT) Forecast, by Application, 2016–2027

Table 49 Latin America Revenue (US$ Bn) Forecast, by End-use Industry, 2016–2027

Table 50 Latin America Volume (KT) Forecast, by End-use Industry, 2016–2027

Table 51 Middle East & Africa Revenue (US$ Bn) Forecast, by Country, 2016–2027

Table 52 Middle East & Africa Volume (KT) Forecast, by Country, 2016–2027

Table 53 Middle East & Africa Revenue (US$ Bn) Forecast, by Function, 2016–2027

Table 54 Middle East & Africa Volume (KT) Forecast, by Function, 2016–2027

Table 55 Middle East & Africa Revenue (US$ Bn) Forecast, by Type, 2016–2027

Table 56 Middle East & Africa Volume (KT) Forecast, by Type, 2016–2027

Table 57 Middle East & Africa Revenue (US$ Bn) Forecast, by Application, 2016–2027

Table 58 Middle East & Africa Volume (KT) Forecast, by Application, 2016–2027

Table 59 Middle East & Africa Revenue (US$ Bn) Forecast, by End-use Industry, 2016–2027

Table 60 Middle East & Africa Volume (KT) Forecast, by End-use Industry, 2016–2027

  • REPORT UPDATE
    IN PROCESS
  • 2019-2032
    (In Process)
  • 2023
    (In Process)

Personalize this Research

  • Granular Research on Specified Regions or Segments
  • Companies Profiled based on User Requirement
  • Broader Insights Pertaining to a Specific Segment or Region
  • Breaking Down Competitive Landscape as per Your Requirement
  • Other Specific Requirement on Customization
Request Customization Banner

Chemicals & Materials Clients

GM
LG Chem
Citibank
Mckinsey
3M

Client Testimonials

“We are quite happy with the methodology you outlined. We really appreciate the time your team has spent on this project, and the efforts of your team to answer our questions.”

- One of the largest & renowned medical research centers based in the U.S. on a report on the U.S. NIPT Market.

“Thanks a million. The report looks great!”

- Feedback from a consultant on a report on the U.S. Beef Market.

“Thanks for the excellent report and the insights regarding the lactose market.”

- Brazil based company specializing in production of protein ingredients.

“I liked the report; would it be possible to send me the PPT version as I want to use a few slides in an internal presentation that I am preparing.”

- Global Digital Services Agency on a report on the Global Luxury Goods Market.

“This report is really well done and we really appreciate it! Again, I may have questions as we dig in deeper. Thanks again for some really good work.”

- U.S.-based biotechnology company focussing on treatment of chronic pain.

“Kudos to your team. Thank you very much for your support and agility to answer our questions.”

- Europe-based provider of solutions to automate data centre operations.

“We appreciate you and your team taking out time to share the report and data file with us, and we are grateful for the flexibility provided to modify the document as per request. This does help us in our business decision making. We would be pleased to work with you again, and hope to continue our business relationship long into the future.”

- India-based manufacturer of industrial and specialty intermediates with a strong global presence.

“I want to first congratulate you on the great work done on the Medical Platforms project. Thank you so much for all your efforts.”

- One of the largest cosmetics company in the world.

“Thank you very much. I really appreciate the work your team has done. I feel very comfortable recommending your services to some of the other startups that I’m working with, and will likely establish a good long partnership with you.”

- U.S. based startup operating in the cultivated meat market.

“We received the below report on the U.S. market from you. We were very satisfied with the report.”

- Global hearing aids manufacturer.

“I just finished my first pass-through of the report. Great work! Thank you!”

- U.S. based solar racking solutions provider.

“Thanks again for the great work on our last partnership. We are ramping up a new project to understand the imaging and imaging service and distribution market in the U.S.”

- World’s leading advisory firm.

“We feel positive about the results. Based on the presented results, we will do strategic review of this new information and might commission a detailed study on some of the modules included in the report after end of the year. Overall we are very satisfied and please pass on the praise to the team. Thank you for the co-operation!”

- Germany based machine construction company.

“Thank you very much for the very good report. I have another requirement on cutting tools, paper crafts and decorative items.”

- Japanese manufacturing company of stationery products.

“We are happy with the professionalism of your in-house research team as well as the quality of your research reports. Looking forward to work together on similar projects”

- One of the Leading Food Companies in Germany

“We appreciate the teamwork and efficiency for such an exhaustive and comprehensive report. The data offered to us was exactly what we were looking for. Thank you!”

- Intuitive Surgical

“I recommend Fortune Business Insights for their honesty and flexibility. Not only that they were very responsive and dealt with all my questions very quickly but they also responded honestly and flexibly to the detailed requests from us in preparing the research report. We value them as a research company worthy of building long-term relationships.”

- Major Food Company in Japan

“Well done Fortune Business Insights! The report covered all the points and was very detailed. Looking forward to work together in the future”

- Ziering Medical

“It has been a delightful experience working with you guys. Thank you Fortune Business Insights for your efforts and prompt response”

- Major Manufacturer of Precision Machine Parts in India

“I had a great experience working with Fortune Business Insights. The report was very accurate and as per my requirements. Very satisfied with the overall report as it has helped me to build strategies for my business”

- Hewlett-Packard

“This is regarding the recent report I bought from Fortune Business insights. Remarkable job and great efforts by your research team. I would also like to thank the back end team for offering a continuous support and stitching together a report that is so comprehensive and exhaustive”

- Global Management Consulting Firm

“Please pass on our sincere thanks to the whole team at Fortune Business Insights. This is a very good piece of work and will be very helpful to us going forward. We know where we will be getting business intelligence from in the future.”

- UK-based Start-up in the Medical Devices Sector

“Thank you for sending the market report and data. It looks quite comprehensive and the data is exactly what I was looking for. I appreciate the timeliness and responsiveness of you and your team.”

- One of the Largest Companies in the Defence Industry
We use cookies to enhance your experience. By continuing to visit this site you agree to our use of cookies . Privacy.
X