Cross Border Payment Market Size, Share & Industry Analysis, By Transaction Type (B2B, B2C, C2B, and C2C), By Channel (Bank Transfer, Card Networks, MTOs, Fintech, and Others {Hybrid, etc.}), By End User (Large Enterprises, SMEs, and Individual Consumers), and Regional Forecast, 2026-2034
KEY MARKET INSIGHTS
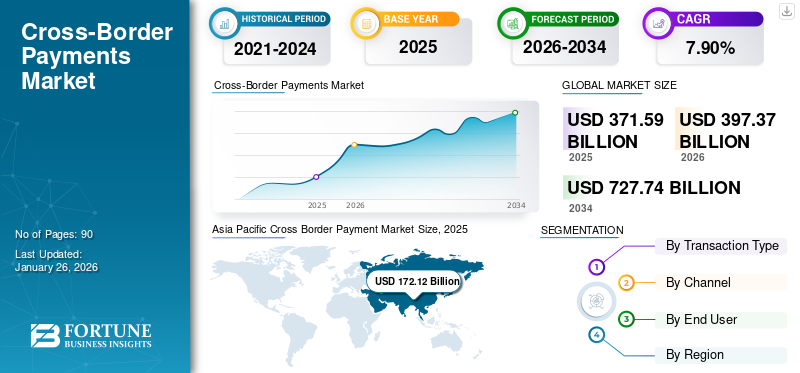
The global cross border payment market size was valued at USD 371.59 billion in 2025. The market is projected to grow from USD 397.37 billion in 2026 to USD 727.74 billion by 2034, exhibiting a CAGR of 7.90% during the forecast period. Asia Pacific dominated the global market with a share of 46.30% in 2025.
A cross-border payment refers to the process of transferring money or assets from a payer to a payee in different countries, enabling international trade of goods and services, personal remittances, and global business. Cross-border payments usually involve foreign exchange as part of the transaction, in addition to differing rules and fees based on the transferring and receiving countries and methods of payment. This makes the entire process vital but a complex process.
The market is experiencing growth due to several factors such as increasing global trade and digital commerce, evolving consumer expectations for immediate, and low-cost transactions as well as the development of fintech solutions.
The main participants in the market include Wise, PayPal, Stripe, Inc., Western Union, MoneyGram International, OFX, Revolut, Payoneer Global Inc., Mastercard, Visa, Nium (Wikipedia), and Papaya Global.
Download Free sample to learn more about this report.
Cross Border Payment Market Key Takeaways
- 2025 Market Size: USD 371.59 Billion
- 2026 Market Size: USD 397.37 Billion
- 2034 Forecast Market Size: USD 727.74 Billion
- CAGR: 7.90% from 2026–2034
- Asia Pacific dominated the cross border payment market with a 46.30% share in 2025.
- The B2B segment is projected to account for a 52.04% share in 2026.
- The bank transfer segment is projected to hold a 48.75% share in 2026.
Asia Pacific
Asia Pacific generated USD 172.12 billion in 2025 and is projected to reach USD 185.71 billion in 2026.
North America
North America accounted for USD 116.72 billion in 2025 and is expected to reach USD 124.42 billion in 2026.
Europe
Europe reached USD 53.05 billion in 2025 and is projected to grow to USD 55.44 billion in 2026.
U.S.
The U.S. market is projected to reach USD 104.03 billion by 2026.
Japan
The cross border payment market is projected to reach USD 14.70 billion in 2026.
Read More
MARKET DYNAMICS
Market Drivers
Globalization 2.0 Spurs Faster, Cheaper, and Interoperable Payments are Driving Market Growth
Globalization 2.0 is speeding up the cross-border payment modernization by creating rapid, cost-effective, and always-on transaction rails. The G20’s cross-border payments roadmap has emphasized its focus on improving speed, transparency, cost-efficiency, and access across global financial systems, thereby driving the widespread reforms. At the same time, the surge in the incorporation of ISO 20022 messaging standards is boosting up interoperability and data richness, allowing for smoother and more structured exchange of financial information.
Instant-payment linkages between domestic systems also further improve inefficiencies for those relying on the traditional correspondent banking model. Collectively, these initiatives promote a move from fragmented legacy chains to streamlined infrastructures that support 24/7 real-time payment processing.
Market Restraints
High Costs and Compliance Friction to Limit Market Scalability
The cross border payment market growth is constrained by continued high costs, fragmentation, and friction associated with compliance. Although global Sustainable Development Goals (SDG) aims to bring down the average remittance fees to 3% by 2030, the average global cost still remains above this target at 6.35% in Q1 2024. High costs are primarily influenced by transfer fees and foreign exchange margins, which have also not decreased significantly. Variations in regulatory standards, sanctions screening, Anti-Money Laundering (AML), and Know Your Customer (KYC) requirements can also add to operational friction and costs. These various costs can limit global market scalability and efficiency while also creating additional challenges for smaller players in the market or for migrant workers who are dependent on affordable remittances.
Market Opportunities
Advancements in AI and Transparency Drive Growth, Creating Opportunities for Innovation
Cross-border payments are expanding rapidly due to advancements in AI, better visibility and transparency, virtual account solutions and partnerships. In response to this growth, global businesses are turning to their banks and fintech partners for solutions that make payments more instant, secure and transparent, helping them to remain competitive in the global marketplace. all to help them remain competitive on the world stage. Also, the early adoption of AI can also help with increasing the productivity. Leveraging AI and ML helps decrease false/positives, reduce the manual workload and friction across the cash payments life cycle. These factors are offering significant market opportunities for innovation, collaboration, and growth in the cross border payment space.
CROSS BORDER PAYMENT MARKET TRENDS
Interoperable Networks & CBDC Pilots Advance from Slideware to Live Pilots as a Major Market Trend
Interoperable networks & CBDC pilots move from slideware to pilots has emerged as a prominent market trend because cross-border interlinking projects like Project Nexus and wholesale CBDC experiments such as mBridge MVP are enabling near-instant settlement solutions, despite shifts in governance like the BIS stepping back. Project Nexus connects domestic Instant Payment Systems (IPS) via a standardized, hub-and-spoke model, eliminating the need for multiple bilateral connections by allowing a single connection to reach all participating countries. This innovation aims to achieve cross border transactions within 60 seconds by integrating foreign exchange conversion and uniform protocols, significantly improving payment speed, cost, and transparency. Meanwhile, CBDC pilots test wholesale use cases to expedite settlements. These advances together drive the shift from conceptual presentations to live pilots, highlighting a key evolution in cross border payments markets toward efficiency and interoperability.
Download Free sample to learn more about this report.
SEGMENTATION ANALYSIS
By Transaction Type
Increase in High-Value Corporate Transactions Boosts B2B Segment Growth
Based on the transaction type, the market is segmented into B2B, B2C, C2B, and C2C.
The B2B segment held the largest revenue share of USD 185.01 billion in the global market in the year 2024 with a expected share of 52.04% in 2026. This is driven by high-value corporate transactions, global supply chain settlements, and treasury operations. Large multinational companies and Small and Medium size Enterprises (SMEs) are highly dependent on international payment systems for imports, exports, vendor settlements, and service outsourcing, resulting in, trillions of dollars in annual transaction flows. The B2B cross border payments segment is therefore the backbone of the market, holding the majority share of the total revenue.
Of all the segments, B2C holds the highest CAGR of 9.6% in the global market. The growth of B2C spending is mainly due to the rise in global e-commerce, online marketplaces, gig economy payouts, and cross-border travel spending. Digital adoption, real time payments, and consumer-focused fintech platforms are lowering transaction barriers, encouraging more consumers to engage in international payments and purchases. Therefore, B2C segment is expected to generate the highest CAGR, relative to other segments, despite its smaller current revenue base.
By Channel
Bank Transfer Segment Dominates Market Owing to Its Widespread Adoption
Based on channel, the market is divided into bank transfer, card networks, MTOs, fintech, and others (hybrid, etc.).
The bank transfer segment is anticipated to hold a dominant market share of 48.75% in 2026. The segment continues to generate the major revenue due to its widespread adoption and is among the most trusted channels for higher value international transactions, especially in B2B and treasury operations. Corporate clients and institutions rely on correspondent banking networks for bulk transfers, trade settlements, and payrolls, which generate the largest transaction volumes. Despite being slower and costlier than digital alternatives, the established infrastructure and regulatory compliance of banks make them the preferred channel for large-scale flows, thereby contributing the highest share of revenue in the market.
Fintech holds the highest CAGR of 9.1% in the global market. The segment’s growth is mainly due its ability to provide cost-effective, rapid, and user-friendly cross-border solutions. The growing customer demand for instant payments, gig economy, and e-commerce and digital wallets also supports the segment’s adoption. Firms such as Wise, Revolut, and Stripe have received considerable traction bypassing the traditional correspondent banking and offering lower fees and transparent exchange rates.
By End User
To know how our report can help streamline your business, Speak to Analyst
Higher Volume of Global Cross-Border Payments Augments the Large Enterprises Segment Growth
Based on the end user, the market is divided into large enterprises, SMEs, and individual consumers.
The large enterprises segment is anticipated to hold a dominant market share of 47.19% in 2026. Large enterprises continue to generate the highest revenues since they have larger transaction sizes, a higher volume of global cross border payments, and higher utilization of premium services.
SMEs represent the largest CAGR at 8.5% in the global market. SMEs are growing faster primarily due to e-commerce growth, supply chain globalization, additional fintech tools that lower friction, regulatory push to lower costs, as well as better access to digital channels.
CROSS BORDER PAYMENT MARKET REGIONAL OUTLOOK
Geographically the market is segmented into North America, Europe, Asia Pacific, South America and Middle East & Africa.
North America
Asia Pacific Cross Border Payment Market Size, 2025 (USD Billion)
To get more information on the regional analysis of this market, Download Free sample
In 2025, North America represented USD 116.72 billion, accounting for 31.40% of the worldwide market, and is projected to grow to USD 124.42 billion in 2026. The regional market is rapidly expanding owing to growing demand for real-time, low-cost, digitally-enabled international transactions, fintech innovation and modernization of payment systems for improved payment efficiency and transparency. Other components driving growth include the growth of e-commerce, increase in global trade, and demand for seamless, secure, and faster cross-border payments. The U.S. is at the forefront of the North American market, with expected revenue of USD 91.56 billion in 2025. This growth is driven by global trade, international investments, and the increasing demand for faster, more cost-effective, and transparent transactions by businesses and consumers. The U.S. market is projected to reach USD 104.03 billion by 2026.
Europe
The Europe market generated USD 53.05 billion in 2025, representing 14.30% of the global market landscape, and is expected to reach USD 55.44 billion in 2026. This growth is due to regulatory initiatives in Europe, such as European Central Bank's effort to improve interoperability and reduce fragmentation between the payment systems of Eurozone countries. The U.K., Germany, and Italy are some of the leading contributors to the growth in the market, with the required revenue stake of USD 12.98 billion USD 8.41 billion and USD 3.09 billion, respectively by 2025. The UK market is projected to reach USD 13.6 billion by 2026, while the Germany market is projected to reach USD 8.79 billion by 2026.
Asia Pacific
Asia Pacific contributed 46.30% to the global market in 2025, with a valuation of USD 172.12 billion, and is projected to reach USD 185.71 billion in 2026. In the region, the rapid digitization and the growth in e-commerce is largely increasing the amount of transactions through retail and B2B channels. Fintech innovation and extensive adoption of mobile wallets and digital banking are lowering the cost of transactions as well as are also increasing access to payment for SMEs. Government initiatives in China, India and Southeast Asian countries is also supporting the upgradation of the payment ecosystem through real-time systems and interoperability initiatives. The Japan market is projected to reach USD 14.7 billion by 2026, the China market is projected to reach USD 46.39 billion by 2026, and the India market is projected to reach USD 27.79 billion by 2026.
At the same time, Asia Pacific is also expected to have the highest CAGR of 8.7%, further solidifying the market as the fastest growing. Asia Pacific's substantial trade flows and remittance corridors sustain high transaction volumes, while continuous infrastructure upgrades and adoption of global standards such as ISO 20022 improve efficiency and transparency.
India and China are major contributors to the market growth with an expected revenue share of USD 25.37 billion and USD 42.9 billion respectively by 2025.
South America and Middle East & Africa
The Middle East & Africa market was valued at USD 18.81 billion in 2025, capturing 5.10% of global revenue, and is estimated to reach USD 20.24 billion in 2026. The South America region captured 2.90% of the global market in 2025, generating USD 10.89 billion in revenue, and is projected to reach USD 11.56 billion in 2026. The markets of South America and Middle East & Africa are growing with an expected valuation of USD 10.9 billion and USD 18.8 billion respectively in 2025 due to increasing ecommerce activity, a high volume of remittances, fintech innovation, and adoption of mobile and digital wallets. GCC countries are predicted to have a market valuation of USD 9.00 billion by 2025.
COMPETITIVE LANDSCAPE
Key Industry Players
Key Players Focusing On Partnerships and Acquisitions to Lead the Industry
The key players in the cross border payments industry include various fintech companies, payment processors, and financial services companies with vast global networks and diverse product offerings. These companies include Wise, PayPal, Stripe, Inc., Western Union, MoneyGram International, OFX, Revolut, Payoneer Global Inc., Mastercard, Visa, Nium (Wikipedia), Papaya Global, and others. These leading firms utilize extensive international networks, innovation in digital and blockchain technologies, regulatory compliance, and partnerships or acquisitions to lead the industry.
LIST OF KEY CROSS BORDER PAYMENT COMPANIES PROFILED
- Wise (U.K.)
- PayPal (U.S.)
- Stripe, Inc. (U.S.)
- Western Union (U.S.)
- MoneyGram International (U.S.)
- OFX (Australia)
- Revolut (U.K.)
- Payoneer Global Inc. (U.S.)
- Mastercard (U.S.)
- Visa (U.S.)
- Nium (Wikipedia)
- Papaya Global (U.S.)
KEY INDUSTRY DEVELOPMENTS
- May 2025- The 28th Ordinary Meeting of the EAC Monetary Affairs Committee (MAC) approved the EAC Cross-border Payment System Masterplan, a transformative initiative aimed at improving financial integration, promoting regional trade and accelerating the region’s journey toward a seamless, efficient, and secure payment ecosystem.
- May 2025- Global payment infrastructure firm Trans-Fi has launched an integrated platform called BizPay which enables immediate, compliant cross-border transactions with more than 250 payment methods in more than 100 countries. BizPay enables businesses and individuals to send and receive money, initiate payouts and accept pay-ins, in minutes.
- April 2025- Circle Internet Group Inc., the issuer of the second-largest stablecoin, is developing a payments network aimed at facilitating cross border transactions using stablecoins. The network will connect financial institutions, payment providers, digital wallet companies, and banking apps to enable real-time settlement of international payments.
- March 2025- Private sector bank Axis has become the first Indian financial institution to offer near-real-time, 24/7 programmable USD clearing for its commercial customers with JP Morgan’s digital assets unit Kinexys.
- November 2024- dLocal, a major cross-border payment platform, and Zepz, the parent company of prominent remittance brands WorldRemit and Sendwave, have announced a strategic partnership aimed at improving payment efficiencies across emerging markets in Africa, Asia, and Latin America. The purpose of this partnership is to address important challenges of these areas due to limited banking access and high costs related to cross -border payments.
REPORT COVERAGE
The global report provides a detailed analysis of the market and focuses on key aspects such as prominent companies, deployment modes, types, and end users of the product. Besides this, it offers insights into the cross-border payment market trends and highlights key industry developments and market share analysis for key companies. In addition to the aforementioned factors, the report encompasses several factors that have contributed to the growth of the market over recent years.
Request for Customization to gain extensive market insights.
Report Scope & Segmentation
|
ATTRIBUTE |
DETAILS |
|
Study Period |
2021-2034 |
|
Base Year |
2025 |
|
Estimated Year |
2026 |
|
Forecast Period |
2026-2034 |
|
Growth Rate |
CAGR of 7.90% from 2026-2034 |
|
Historical Period |
2021-2024 |
|
Unit |
Value (USD Billion) |
|
Segmentation |
By Transaction Type · B2B · B2C · C2B · C2C |
|
By Channel · Bank Transfer · Card Networks · MTOs · Fintech · Others |
|
|
By End User · Large Enterprises · SMEs · Individual Consumers |
|
|
By Region · North America (By Transaction Type, Channel, End User and Country/Sub-region) o U.S. (By End User) o Canada (By End User) o Mexico (By End User) · Europe (By Transaction Type, Channel, End User and Country/Sub-region) o U.K. (By End User) o Germany (By End User) o France (By End User) o Italy (By End User) o Spain (By End User) o BENELUX (By End User) o Nordics (By End User) o Russia (By End User) o Rest of Europe (By End User) · Asia Pacific (By Transaction Type, Channel, End User, and Country/Sub-region) o China (By End User) o Japan (By End User) o India (By End User) o South Korea (By End User) o Rest of Asia Pacific (By End User) · South America (By Transaction Type, Channel, End User, and Country/Sub-region) o Argentina (By End User) o Brazil (By End User) o Rest of South America (By End User) · Middle East & Africa (By Transaction Type, Channel, End User, and Country/Sub-region) o GCC (By End User) o South Africa (By End User) o Israel (By End User) o Rest of the Middle East & Africa (By End User) |
Frequently Asked Questions
Fortune Business Insights says that the global market stood at USD 371.59 billion in 2025 and is projected to reach USD 727.74 billion by 2034.
The market is expected to exhibit steady growth at a CAGR of 7.90% during the forecast period.
Globalization 2.0 is driving the market growth.
OFX, Revolut, Payoneer Global Inc., Mastercard, Visa, Nium (Wikipedia), and Papaya Global are the top players in the market.
Asia Pacific region held the largest market share.
North America was valued at USD 116.72 billion in 2025.


- 2021-2034
- 2025
- 2021-2024
- 90
Get 30-60 hrs Free Customization
Expand Regional and Country Coverage, Segments Analysis, Company Profiles, Competitive Benchmarking, and End-user Insights.
-
US +1 833 909 2966 ( Toll Free )
-
Get In Touch With Us