"Market Intelligence for High-Geared Performance"

Automotive Smart Display Market Size, Share & Industry Analysis, By Size Type (3”-5”, 6”-10”, >10”), By Technology Type (LCD, TFT-LCD, and Others), By Application (Head-up Display, Center Stack, Digital Instrument Cluster, and Rear Seat Entertainment), By Vehicle Type (Passenger Cars and Commercial Vehicles), and Regional Forecast, 2020-2027

Region : Global | Format: PDF | Report ID: FBI104610


KEY MARKET INSIGHTS

Play Audio Listen to Audio Version

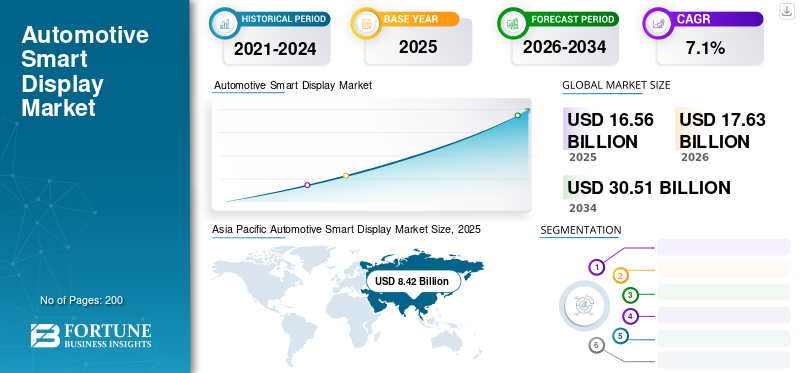
The global automotive smart display market size was valued at USD 2.90 billion in 2019 and is projected to reach USD 6.99 billion by 2027, at a CAGR of 18.7% during the forecast period. The growing demand for advanced driver assistance systems (ADAS), rising trend of connected cars, & growing consumer preference for in-vehicle infotainment systems will support the market growth during the forecast period.


An automotive smart display is a wireless touch screen device that is designed to improve the safety and security of the occupants in the vehicle. These displays ensure vehicular safety by providing driver safety functions, interference-free multimedia functions, and real-time diagnostic and vehicle navigation functions, including battery temperature, fuel capacity, engine heat, and tire pressure indicators. Wireless smart display systems are powered by a battery, usually installed in private and commercial vehicles. The available size range of automotive smart displays is 3 inches to 15 inches.


Nowadays, smart display manufacturers are offering unique designs for TFT-LCD and LCD display panels owing to the increasing integration of vehicle functions in display applications. The advanced smart display systems also include vehicle-to-vehicle and vehicle-to-infrastructure connectivity to enhance the driving experience.


Also, prominent automobile manufacturers are investing a high percentage of their revenues in innovation and focusing on developing slim and sleek designs for vehicle interiors, displays, and dashboards to enhance the overall look of the vehicle and also provide it with advanced safety and security features to customers. The growth of the global market can be attributed to the increasing demand for high-performance vehicles and luxury cars as well as the rising awareness of safety functions in vehicles among consumers and manufacturers.


Decline in Automotive Sales and Production amid COVID-19 to Affect the Smart Display Market


China is a chief contributor to the rapid development of the automotive industry as well as a major supplier of several auto parts and technologies. Various countries have been impacted owing to the stringent restrictions imposed by governments on cross-border trade in order to control the COVID-19 pandemic. In this pandemic situation, the automotive industry has been harshly affected, which has posed several challenges for this market. The automotive industry plays a critical role in global economic development, accounting for nearly 16% of the global GDP in 2018. Also, as a result of this pandemic, most of the vehicle manufacturing plants have been closed down temporarily.


Prominent automotive smart display manufacturers, including Denso, LG Display, Continental AG, Nippon Seiki, Robert Bosch GmbH, and Garmin have declared that they will have to adjust or suspend production operations owing to the lower demand and supply chain bottlenecks and to ensure the safety of their employees around the globe during the COVID-19 pandemic. Visteon, for instance, has adopted exigent measures to manage the costs and losses as well as maintain liquidity, including effective cost management due to this pandemic. The company has provisionally adjourned and reduced production capacities at some of its factories in Europe, the Americas, and most of Asia due to governmental restrictions on trade and movement of people and the decline in the demand for parts due to the deferral of major OEMs. All these factors are ultimately expected to decline the automotive smart display market growth.


LATEST TRENDS


Request a Free sample to learn more about this report.


Rapid Adoption of OLED Panels to Set a Positive Trend in the Market


The rapid adoption of OLED screens and the emergence of augmented reality-based technologies and autonomous vehicles are expected to augment the potential of this market. It is generally believed that the speedy development of new-age technologies such as big data, Artificial Intelligence (AI), augmented reality (AR), and autonomous driving will encourage the global automotive industry to bring about massive changes in the manufacturing, sales, and overall business models. This market is a vertical market that has wholeheartedly embraced these technologies, thereby enhancing its commercialization prospects.


The integration of interactive displays (displays that are highly responsive to visual and touch stimuli) has become a significant feature of the manufacturing processes used by most of the key automotive players. OLED displays are increasingly gaining high preference among prominent automobile companies such as Volkswagen, General Motors, Mercedes-Benz, Toyota, and Audi. For instance, Mercedes Benz is collaborating with LG Display to integrate OLED panels in rear-seat displays and on the dashboards of its new cars. Mercedes-Benz will become the first car manufacturer to use OLED for its consumer models.


DRIVING FACTORS


Integration of Smartphone Connectivity in Cars to Drive Market Growth


The synchronization of smartphones and infotainment systems such as Apple CarPlay, Spotify, and Android Auto is expected to increase the demand for smart displays in vehicles. The similarity between Android Auto and Apple CarPlay is that they make use of smartphones to run the operating systems that have been augmented for road applications. These systems integrate advanced functions, including cockpit electronics and easy access to music, and enable easy navigation without distracting the driver. These operating systems also incorporate voice assistance such as Google Assistant and Apple Siri to provide a hands-free experience. It is essential for carmakers to integrate an appropriate kit to run the operating system efficiently. Therefore, a growing number of manufacturers are adopting this technology in their vehicles by allowing supporting features as standard or at least as an option for their infotainment systems.


Increasing Focus on 5G and Wireless Technologies to Boost the Market


With the increasing popularity of wireless technologies, the emergence of 5G technology is likely to create multiple opportunities for this market. 5G networks provide high-speed internet, which assists in the integration of automotive smart display systems with advanced features, including cloud gaming, augmented reality (AR), virtual reality (VR), and media streaming. These applications involve better quality displays, which are expected to boost the demand for smart displays in cars.


Manufacturers are integrating wireless features in smart displays by making extensive use of solutions in the Internet of Things (IoT) field in order to provide a portable display experience to their customers and enhance comfort in operating the system. Wireless solutions are also boosting the applications of smart displays in heads-up display systems and rear-seat entertainment systems for passengers. For instance, LG Display, in collaboration with Qualcomm Technologies, developed a solution for 5G connected cars. The 5G technology provides assistance to the V2I and V2V communication in vehicles, which is among the key objectives of the organization.


RESTRAINING FACTORS


Rising Threat of Cyber-Attacks and High Costs May Hamper the Market


Globally, with the rapid adoption of advanced technologies, the majority of modern vehicles are equipped with the latest features that usually use wireless technologies, which ultimately increase the risk of cyber-attacks. Further, increased vehicle connectivity through various devices such as smartphones, navigation systems, tablets, and music players also heightens the network-breaching risk in vehicles. When these portable devices are connected to the vehicle, malicious software and viruses may attack the electronic systems through the vehicle information terminal or vehicle entertainment system.


Excessive and vulnerable connections also increase the threat of being hacked. Since security and privacy are the foundations of telematics offerings, the current global economic situation shows that the inclination of people is shifting towards advanced technologies. The information collected may be misused through telematics. Cyber-criminals may hack into vehicle applications to gather data or feed the system with the wrong data. Moreover, there is a high risk of the data getting shared with third parties without permission by the application providers and the Telecommunications Service Providers (TSP). For example, according to a news article by a cyber-security consultant, a hacker offered to sell personal data of around 3.5 million Zoomcar users for USD 300 on the Dark Web, where the content cannot be searched using search engines as it is encrypted. The data mainly includes names, mobile numbers, IP addresses, e-mails, and passwords.


Prominent key players are investing large amounts of money in research to develop smart display systems for vehicles that make use of advanced technologies such as AI. These advanced features in vehicles incur added costs to the manufacturers, which eventually leads to an increase in the production cost of the vehicles, thus restraining the growth of the market.


SEGMENTATION


By Size Type Analysis


To know how our report can help streamline your business, Speak to Analyst


6”-10” Segment Held the Largest Share Backed by Its Lightweight Property


Based on size type, the market is segmented into 3”-5”, 6”-10”, and >10 inches. The 6”-10” segment accounts for the highest share in the global market. The majority of the mid-sized cars and SUVs are integrated with smart displays with sizes ranging from 6” to 10”. Growing demand for the integration of electronic systems with safety and security features and increasing use of in-vehicle smart display applications are leading to the adoption of autonomous and semi-autonomous vehicles, thus creating a high demand for smart displays. Moreover, OEMs and technology-driven companies are joining forces to develop semi-autonomous and self-driving cars with enhanced safety features, thereby addressing consumers’ concerns. The development of autonomous vehicle technologies will lead to greater adoption of automotive smart displays with large screen sizes to provide advanced driver assistance through a single touchscreen platform. For instance, in April 2020, Audi launched its latest fourth-generation A3 sedan equipped with an integrated 10-inch smart display, which is compatible with both Apple CarPlay and Android Auto applications.


The more than 10 inches’ segment is expected to grow rapidly in the coming years as vehicle interiors get more digitized, raising the demand for larger displays.


By Technology Type Analysis


TFT-LCD Segment to Dominate the Market over the Forecast Period


The smart displays used in vehicles are usually TFT-LCD, which is being extensively utilized owing to its multiple benefits such as high resolution, high brightness, reliability, and low cost in the challenging automotive sector. TFT-LCD panels can display monochrome or full-color videos from a DVD, camera, or any other video input and can be used as a multi-character display while incorporating data from other sources. TFT-LCDs can receive instructions from the automotive electronic control unit (ECU) with the help of microcontrollers and can process different types of signals.


Nowadays, TFT LCDs are integrated into vehicles for controlling audio and air conditioning functions, driver information displays or instrument panel displays, and after-sales navigation devices. Latest vehicles are equipped with multiple applications for modern TFT LCDs. The center stack touchscreens display vehicle information such as the vehicle’s audible alarm, gear position, and rear-view video parking assist. The side-view mirrors and rear-view mirrors can also be integrated with TFT-LCD displays along with the video. Also, several electric and hybrid cars incorporate TFT displays to indicate battery life and gas gauge levels. Moreover, manufacturers have upgraded their TFT LCD technologies that are used for televisions and computer monitors as the sizes of displays have become bigger. Therefore, the existing displays installed in cars are benefitting through advanced software and hardware. For instance, in April 2019, Mitsubishi Electric Corporation launched its new TFT-LCD displays for automobiles, ships, and agricultural machinery that require big screens with enhanced performance and superior quality.


The LCD segment is also anticipated to show significant growth in the market, owing to its increasing adoption in compact car models. LCD smart displays are mostly used in compact-sized cars having a display size of 3 to 5 inches. Also, the growing demand for rear-seat entertainment touchscreen displays in vehicles is creating growth opportunities for LCD smart display makers.


By Application Type Analysis


Center Stack Segment to Lead Market Share


Based on application type, the market is segmented into center stack, head-up display, digital instrument cluster, and rear-seat entertainment. The center stack segment accounts for the largest share in the global market. A central stack display is an infotainment system that provides interactive content such as cabin temperature controls, phone management, navigation, music, and other entertainment data. The rapid development of autonomous vehicles and connected cars are the major factors fueling the demand for center stack displays in vehicles. Further, the increasing usage of electronic components, elimination of multiple screens, and integration of advanced systems such as telematics and infotainment systems are driving the growth of this segment. The rapid adoption of advanced technologies in automotive center stack units to enhance vehicular functions and the entry of major technology players such as Apple are the driving factors for this segment.  For example, the new CarPlay system launched by Apple allows drivers to use their vehicle touch screens to access Apple’s applications for phone numbers, calling, e-mails, navigation, music, and others.


By Vehicle Type Analysis


Rising Production of Passenger Vehicles to Boost the Passenger Car Segment


The passenger car segment is expected to dominate the market during the forecast period. Passenger cars account for the largest share of the total global automobile production. Additionally, rising innovations by key OEMs to improve the driving quality and efficiency of passenger cars will promote this segment’s growth. The increase in disposable incomes of consumers, especially in developing countries such as China, India, and Mexico, is fueling the demand for smart car displays in the passenger car segment. Increasing investments by governments to promote the adoption of electric vehicles is also boosting the demand for passenger cars. For example, in 2019, the Indian government launched the National Electric Mobility Mission Plan 2020 to encourage local manufacturers to produce auto components and smart systems for vehicles. Under this program, the government has invested more than USD 130 billion for providing incentives to local manufacturers and around USD 18 billion for R&D purposes. This initiative is aimed to eventually reduce the manufacturing cost of advanced systems in vehicles as well as increase sales in the forthcoming years. 


REGIONAL INSIGHTS


Asia Pacific Automotive Smart Display Market Size, 2019 (USD Billion)

To get more information on the regional analysis of this market, Request a Free sample


Based on region, the market is grouped into North America, Europe, Asia Pacific, and the Rest of the World. Asia Pacific leads the automotive smart display market share and is expected to maintain its leading position during the forecast period. This growth is attributed to the increasing demand for vehicles as well as the growing cases of road accidents and the need to implement safety features in vehicles to ensure the safety of the occupants and the pedestrians. Developing and developed countries, including India, China, Japan, and South Korea, have contributed to the high growth and production of vehicles in this region. The existence of global manufacturers such as BHTC and Faurecia SA coupled with the enormous demand for aftermarket automotive smart displays in India is propelling market growth in this region.


North America is expected to account for the second-largest share in terms of revenue. The high purchasing power of consumers in Canada and the United States has led to an increased demand for passenger cars in these countries. Also, the increasing demand for advanced electronic and vehicle connectivity systems such as infotainment, telematics, and V2V and V2I features and the rising need for enhanced safety and comfort in vehicles is driving market growth in this region.


Europe is expected to show lucrative growth in the global market in the coming years. The rapid adoption of advanced technologies such as 5G connectivity will help the region to showcase healthy growth in the market.


KEY INDUSTRY PLAYERS


Continental AG to be the Leading Player in the Market


Continental AG is one of the most dominant players in this market. The company’s ultimate vision is to deploy various advanced connectivity solutions and develop driverless cars to achieve smart and safe mobility. Moreover, the constant focus on research and development is driving technological innovation, which is a significant aspect that is contributing to the company's leading position in this space.


Furthermore, increasing collaborations among automotive manufacturers, technology providers, and semiconductor suppliers are expected to remain a key business strategy, helping companies gain prominence in the global market.


LIST OF KEY COMPANIES PROFILED:


  • Delphi Automotive PLC (Dublin, Ireland)

  • Robert Bosch GmbH (Gerlingen, Germany)

  • Valeo SA (Paris, France)

  • Continental AG (Hanover, Germany)

  • Japan Display Inc. (Tokyo, Japan)

  • AU Optronics Corporation (Hsinchu, Taiwan)

  • Yazaki Corporation (Tokyo, Japan)

  • Kyocera Display Corporation (Shanghai, China)

  • LG Display Co. Ltd. (Seoul, South Korea)

  • Magna International Inc. (Aurora, Canada)

  • Denso Corporation (Aichi, Japan)

  • Panasonic (Hsinchu, Taiwan)

  • Nippon Seiki Co. Ltd. (Niigata, Japan)

  • Alpine Electronics (Tokyo, Japan)


KEY INDUSTRY DEVELOPMENTS:


  • In January 2021, Qualcomm Technologies, Inc. and Alps Alpine Co., Ltd. recently announced that they would be working together to develop ViewPose, a new camera-based sensing and positioning system that will provide absolute lane-level vehicle positioning in almost any environment.

  • In January 2021, Panasonic Automotive Systems Company, a tier one global automotive supplier, has announced the launch of the world's first fully wireless Wi-Fi camera that offers convenience, durability, and increased ease of use for recreational hauling.

  • In June 2021, Pioneer Corporation and Cerence Inc. announced that they have committed to establish a strategic partnership to develop scalable, secure, AI-powered mobility products and services.

  • In November 2020, Denso Corporation, a leading mobility supplier, invested in Lambda:4, a German company that develops wireless technologies for short-range applications using Bluetooth Low Energy. This will help DENSO enhance the location accuracy and user authentication capabilities of its passive digital key.


REPORT COVERAGE


An Infographic Representation of Automotive Smart Display Market

To get information on various segments, share your queries with us


The automotive smart display market research report provides a detailed analysis of the market and focuses on key aspects such as leading companies, product types, and leading applications of the product. Besides this, the report offers insights into the current market trends and highlights key industry developments. In addition to the aforementioned factors, the report delivers an in-depth market analysis of several factors that have contributed to its growth over recent years.


Report Scope & Segmentation


 ATTRIBUTE


  DETAILS


Study Period


  2016-2027


Base Year


  2019


Forecast Period


  2020-2027


Historical Period


  2016-2018


Unit


  Value (USD Billion) & Volume (Thousand Units)


Segmentation


By Size Type


  • 3”-5”

  • 6”-10”

  • >10”


By Technology Type


  • LCD

  • TFT-LCD

  • Others


By Application Type


  • Head-up Display

  • Center Stack

  • Digital Instrument Cluster

  • Rear Seat Entertainment


By Vehicle Type


  • Passenger Cars

  • Commercial Vehicles


By Geography


  • North America (The U.S., Canada, and Mexico)

  • Europe (The U.K., Germany, France, and Rest of Europe)

  • Asia Pacific (China, Japan, India, South Korea, and Rest of Asia Pacific)

  • Rest of the World


Frequently Asked Questions

Fortune Business Insights says that the global automotive smart display market size was USD 2.90 billion in 2019 and is projected to reach USD 6.99 billion by 2027.

In 2019, the Asia Pacific automotive smart display market value stood at USD 1.34 billion.

Registering a CAGR of 18.7%, the automotive smart display market will exhibit promising growth in the forecast period (2020-2027).

The TFT-LCD technology type segment is expected to be the leading segment in this market during the forecast period.

The rising production of passenger cars and commercial vehicles is the key factor driving the growth of the market.

Continental AG, Robert Bosch GmbH, and Valeo SA are the major players in the global market.

Asia Pacific held the largest share in the market in 2019.

Rising demand and adoption of 5G and wireless technologies are expected to drive the adoption of smart displays in vehicles.

Seeking Comprehensive Intelligence on Different Markets?
Get in Touch with Our Experts

Speak to an Expert

Table of Content:

  1. Introduction
    1. Research Scope
    2. Market Segmentation
    3. Research Methodology
    4. Definitions and Assumptions
  2. Executive Summary
  3. Market Dynamics
    1. Market Drivers
    2. Market Restraints
    3. Market Opportunities
  4. Key Insights
    1. Merger, Acquisitions, and Partnerships
    2. Distributor Analysis – For Major Players
    3. Growth and Penetration Analysis
    4. Porter’s Five Forces Analysis
    5. PEST Analysis
    6. Vendor Landscape
  5. Global Automotive Smart Display Market Analysis, Insights and Forecast, 2016-2027
    1. Key Findings / Summary
    2. Market Analysis, Insights and Forecast – By Size
      1. 3"-5"
      2. 6"-10"
      3. >10"
    3. Market Analysis, Insights and Forecast – By Technology Type
      1. LCD
      2. TFT-LCD
      3. Others
    4. Market Analysis, Insights and Forecast – By Application Type
      1. Center Stack
      2. Headsup Display
      3. Digital Instrumental Cluster
      4. Rear Seat Entertainment
    5. Market Analysis, Insights and Forecast – By Vehicle Type
      1. Passenger Cars
      2. Commercial Vehicles
    6. Market Analysis, Insights and Forecast – By Region
      1. North America
      2. Europe
      3. Asia pacific
      4. Rest of the World
  6. North America Automotive Smart Display Market Analysis, Insights and Forecast, 2016-2027
    1. Key Findings / Summary
    2. Market Analysis – By Size
      1. 3"-5"
      2. 6"-10"
      3. >10"
    3. Market Analysis – By Technology Type
      1. LCD
      2. TFT-LCD
      3. Others
    4. Market Analysis, Insights and Forecast – By Application Type
      1. Center Stack
      2. Headsup Display
      3. Digital Instrumental Cluster
      4. Rear Seat Entertainment
    5. Market Analysis, Insights and Forecast – By Vehicle Type
      1. Passenger Cars
      2. Commercial Vehicles
    6. Market Analysis – By Country
      1. U.S.
      2. Canada
      3. Mexico
  7. Europe Automotive Smart Display Market Analysis, Insights and Forecast, 2016-2027
    1. Key Findings / Summary
    2. Market Analysis – By Size
      1. 3"-5"
      2. 6"-10"
      3. >10"
    3. Market Analysis – By Technology Type
      1. LCD
      2. TFT-LCD
      3. Others
    4. Market Analysis, Insights and Forecast – By Application Type
      1. Center Stack
      2. Headsup Display
      3. Digital Instrumental Cluster
      4. Rear Seat Entertainment
    5. Market Analysis, Insights and Forecast – By Vehicle Type
      1. Passenger Cars
      2. Commercial Vehicles
    6. Market Analysis – By Country
      1. U.K.
      2. Germany
      3. France
      4. Rest of Europe
  8. Asia pacific Automotive Smart Display Market Analysis, Insights and Forecast, 2016-2027
    1. Key Findings / Summary
    2. Market Analysis – By Size
      1. 3"-5"
      2. 6"-10"
      3. >10"
    3. Market Analysis – By Technology Type
      1. LCD
      2. TFT-LCD
      3. Others
    4. Market Analysis, Insights and Forecast – By Application Type
      1. Center Stack
      2. Headsup Display
      3. Digital Instrumental Cluster
      4. Rear Seat Entertainment
    5. Market Analysis, Insights and Forecast – By Vehicle Type
      1. Passenger Cars
      2. Commercial Vehicles
    6. Market Analysis – By Country
      1. Japan
      2. China
      3. India
      4. South Korea
      5. Rest of Asia Pacific
  9. Rest of the World Automotive Smart Display Market Analysis, Insights and Forecast, 2016-2027
    1. Key Findings / Summary
    2. Market Analysis – By Size
      1. 3"-5"
      2. 6"-10"
      3. >10"
    3. Market Analysis – By Technology Type
      1. LCD
      2. TFT-LCD
      3. Others
    4. Market Analysis, Insights and Forecast – By Application Type
      1. Center Stack
      2. Headsup Display
      3. Digital Instrumental Cluster
      4. Rear Seat Entertainment
    5. Market Analysis, Insights and Forecast – By Vehicle Type
      1. Passenger Cars
      2. Commercial Vehicles
  10. Competitive Analysis
    1. Key Industry Developments
    2. Global Market Share Analysis (2018)
    3. Competition Dashboard
    4. Comparative Analysis – Major Players
    5. Company Profiles
      1. Delphi Automotive LLP
        1. Overview,
        2. Products & services,
        3. SWOT analysis,
        4. Recent developments,
        5. strategies,
        6. financials (based on availability)
      2. Continental AG
        1. Overview,
        2. Products & services,
        3. SWOT analysis,
        4. Recent developments,
        5. strategies,
        6. financials (based on availability)
      3. Robert Bosch GmbH
        1. Overview,
        2. Products & services,
        3. SWOT analysis,
        4. Recent developments,
        5. strategies,
        6. financials (based on availability)
      4. Valeo SA
        1. Overview,
        2. Products & services,
        3. SWOT analysis,
        4. Recent developments,
        5. strategies,
        6. financials (based on availability)
      5. Japan Display Inc
        1. Overview,
        2. Products & services,
        3. SWOT analysis,
        4. Recent developments,
        5. strategies,
        6. financials (based on availability)
      6. Denso Corporation
        1. Overview,
        2. Products & services,
        3. SWOT analysis,
        4. Recent developments,
        5. strategies,
        6. financials (based on availability)
      7. Panasonic
        1. Overview,
        2. Products & services,
        3. SWOT analysis,
        4. Recent developments,
        5. strategies,
        6. financials (based on availability)
      8. Magna International Inc.
        1. Overview,
        2. Products & services,
        3. SWOT analysis,
        4. Recent developments,
        5. strategies,
        6. financials (based on availability)
      9. LG Display Co. Ltd
        1. Overview,
        2. Products & services,
        3. SWOT analysis,
        4. Recent developments,
        5. strategies,
        6. financials (based on availability)

List of Figure

Figure 1:  Global Automotive Smart Display Market Breakdown (Thousand Units, %) by Region, 2016 & 2027

Figure 2:  Global Automotive Smart Display Market Size Share (%), by Size Type, 2016 & 2027

Figure 3:  Global Automotive Smart Display Market Size Share (%), by Technology Type, 2016 & 2027

Figure 4:  Global Automotive Smart Display Market Size Share (%), by Application Type, 2016 & 2027

Figure 5:  Global Automotive Smart Display Market Size Share (%), by Vehicle Type, 2016 & 2027

Figure 6:  Global Automotive Smart Display Market (Thousand Units), by Region, 2016 & 2027

Figure 7:  North America Automotive Smart Display Market (Thousand Units), by Size Type, 2016 & 2027

Figure 8:  North America Automotive Smart Display Market Size (%), by Size Type, 2016 & 2027

Figure 9:  North America Automotive Smart Display Market (Thousand Units), by Technology Type, 2016 & 2027

Figure 10:  North America Automotive Smart Display Market Size (%), by Technology Type, 2016 & 2027

Figure 11:  North America Automotive Smart Display Market (Thousand Units), by Application Type, 2016 & 2027

Figure 12:  North America Automotive Smart Display Market Size Share (%), by Application Type, 2016

Figure 13:  North America Automotive Smart Display Market (Thousand Units), by Vehicle Type, 2016 & 2027

Figure 14:  North America Automotive Smart Display Market Size Share (%), by Vehicle Type, 2016

Figure 15:  North America Automotive Smart Display Market (Thousand Units), By Country, 2016 & 2027

Figure 16:  North America Automotive Smart Display Market Size Share (%), By Country, 2016

Figure 17:  Europe Automotive Smart Display Market (Thousand Units), by Size Type, 2016 & 2027

Figure 18:  Europe Automotive Smart Display Market Size (%), by Size Type, 2016 & 2027

Figure 19:  Europe Automotive Smart Display Market (Thousand Units), by Technology Type, 2016 & 2027

Figure 20:  Europe Automotive Smart Display Market Size (%), by Technology Type, 2016 & 2027

Figure 21:  Europe Automotive Smart Display Market (Thousand Units), by Application Type, 2016 & 2027

Figure 22:  Europe Automotive Smart Display Market Size Share (%), by Application Type, 2016

Figure 23:  Europe Automotive Smart Display Market (Thousand Units), by Vehicle Type, 2016 & 2027

Figure 24:  Europe Automotive Smart Display Market Size Share (%), by Vehicle Type, 2016

Figure 25:  Europe Automotive Smart Display Market (Thousand Units), By Country, 2016 & 2027

Figure 26:  Europe Automotive Smart Display Market Size Share (%), By Country, 2016

Figure 27:  Asia Pacific Automotive Smart Display Market (Thousand Units), by Size Type, 2016 & 2027

Figure 28:  Asia Pacific Automotive Smart Display Market Size (%), by Size Type, 2016 & 2027

Figure 29:  Asia Pacific Automotive Smart Display Market (Thousand Units), by Technology Type, 2016 & 2027

Figure 30:  Asia Pacific Automotive Smart Display Market Size (%), by Technology Type, 2016 & 2027

Figure 31:  Asia Pacific Automotive Smart Display Market (Thousand Units), by Application Type, 2016 & 2027

Figure 32:  Asia Pacific Automotive Smart Display Market Size Share (%), by Application Type, 2016

Figure 33:  Asia Pacific Automotive Smart Display Market (Thousand Units), by Vehicle Type, 2016 & 2027

Figure 34:  Asia Pacific Automotive Smart Display Market Size Share (%), by Vehicle Type, 2016

Figure 35:  Asia Pacific Automotive Smart Display Market (Thousand Units), By Country, 2016 & 2027

Figure 36:  Asia Pacific Automotive Smart Display Market Size Share (%), By Country, 2016

Figure 37:  Rest of the World Automotive Smart Display Market (Thousand Units), by Size Type, 2016 & 2027

Figure 38:  Rest of the World Automotive Smart Display Market Size (%), by Size Type, 2016 & 2027

Figure 39:  Rest of the World Automotive Smart Display Market (Thousand Units), by Technology Type, 2016 & 2027

Figure 40:  Rest of the World Automotive Smart Display Market Size (%), by Technology Type, 2016 & 2027

Figure 41:  Rest of the World Automotive Smart Display Market (Thousand Units), by Application Type, 2016 & 2027

Figure 42:  Rest of the World Automotive Smart Display Market Size Share (%), by Application Type, 2016

Figure 43:  Rest of the World Automotive Smart Display Market (Thousand Units), by Vehicle Type, 2016 & 2027

Figure 44:  Rest of the World Automotive Smart Display Market Size Share (%), by Vehicle Type, 2016

Figure 45:  Global Automotive Smart Display Market Share (%), By Company, 2016

List of Table

Table 1:  Global Automotive Smart Display Market (Thousand Units) Forecast, by Size Type, 2016-2027

Table 2:  Global Automotive Smart Display Market Revenue (USD Billion) Forecast, by Size Type, 2016-2027

Table 3:  Global Automotive Smart Display Market (Thousand Units) Forecast, by 3"-5", 2016-2027

Table 4:  Global Automotive Smart Display Market Revenue (USD Billion) Forecast, by 3"-5", 2016-2027

Table 5:  Global Automotive Smart Display Market (Thousand Units) Forecast, by 6"-10", 2016-2027

Table 6:  Global Automotive Smart Display Market Revenue (USD Billion) Forecast, by 6"-10", 2016-2027

Table 7:  Global Automotive Smart Display Market (Thousand Units) Forecast, by >10", 2016-2027

Table 8:  Global Automotive Smart Display Market Revenue (USD Billion) Forecast, by >10", 2016-2027

Table 9:  Global Automotive Smart Display Market (Thousand Units) Forecast, by Technology Type, 2016-2027

Table 10:  Global Automotive Smart Display Market Revenue (USD Billion) Forecast, by Technology Type, 2016-2027

Table 11:  Global Automotive Smart Display Market (Thousand Units) Forecast, by LCD, 2016-2027

Table 12:  Global Automotive Smart Display Market Revenue (USD Billion) Forecast, by LCD, 2016-2027

Table 13:  Global Automotive Smart Display Market (Thousand Units) Forecast, by TFT-LCD, 2016-2027

Table 14:  Global Automotive Smart Display Market Revenue (USD Billion) Forecast, by TFT-LCD, 2016-2027

Table 15:  Global Automotive Smart Display Market (Thousand Units) Forecast, by Others, 2016-2027

Table 16:  Global Automotive Smart Display Market Revenue (USD Billion) Forecast, by Others, 2016-2027

Table 17:  Global Automotive Smart Display Market (Thousand Units) Forecast, by Application Type, 2016-2027

Table 18:  Global Automotive Smart Display Market Revenue (USD Billion) Forecast, by Application Type, 2016-2027

Table 19:  Global Automotive Smart Display Market (Thousand Units) Forecast, by Center Stack, 2016-2027

Table 20:  Global Automotive Smart Display Market Revenue (USD Billion) Forecast, by Center Stack, 2016-2027

Table 21:  Global Automotive Smart Display Market (Thousand Units) Forecast, by Headup Display, 2016-2027

Table 22:  Global Automotive Smart Display Market Revenue (USD Billion) Forecast, by Headup Display, 2016-2027

Table 23:  Global Automotive Smart Display Market (Thousand Units) Forecast, by Digital Instrumental Cluster, 2016-2027

Table 24:  Global Automotive Smart Display Market Revenue (USD Billion) Forecast, by Digital Instrumental Cluster, 2016-2027

Table 25:  Global Automotive Smart Display Market (Thousand Units) Forecast, by Rear Seat Entertainment, 2016-2027

Table 26:  Global Automotive Smart Display Market Revenue (USD Billion) Forecast, by Rear Seat Entertainment, 2016-2027

Table 27:  Global Automotive Smart Display Market (Thousand Units) Forecast, by Vehicle Type, 2016-2027

Table 28:  Global Automotive Smart Display Market Revenue (USD Billion) Forecast, by Vehicle Type, 2016-2027

Table 29:  Global Automotive Smart Display Market (Thousand Units) Forecast, by Passenger Cars Type, 2016-2027

Table 30:  Global Automotive Smart Display Market Revenue (USD Billion) Forecast, by Passenger Cars Type, 2016-2027

Table 31:  Global Automotive Smart Display Market (Thousand Units) Forecast, by Commercial Vehicles Type, 2016-2027

Table 32:  Global Automotive Smart Display Market Revenue (USD Billion) Forecast, by Commercial Vehicles Type, 2016-2027

Table 33:  North America Automotive Smart Display Market (Thousand Units) Forecast, by Region, 2016-2027

Table 34:  North America Automotive Smart Display Market Revenue (USD Billion) Forecast, by Region, 2016-2027

Table 35:  North America Automotive Smart Display Market (Thousand Units) Forecast, by Size Type, 2016-2027

Table 36:  North America Automotive Smart Display Market Revenue (USD Billion) Forecast, by Size Type, 2016-2027

Table 37:  North America Automotive Smart Display Market (Thousand Units) Forecast, by 3"-5", 2016-2027

Table 38:  North America Automotive Smart Display Market Revenue (USD Units) Forecast, by 3"-5", 2016-2027

Table 39:  North America Automotive Smart Display Market (Thousand Units) Forecast, by 6"-10", 2016-2027

Table 40:  North America Automotive Smart Display Market Revenue (USD Billion) Forecast, by 6"-10", 2016-2027

Table 41:  North America Automotive Smart Display Market (Thousand Units) Forecast, by >10", 2016-2027

Table 42:  North America Automotive Smart Display Market Revenue (USD Billion) Forecast, by >10", 2016-2027

Table 43:  North America Automotive Smart Display Market (Thousand Units) Forecast, by Technology Type, 2016-2027

Table 44:  North America Automotive Smart Display Market Revenue (USD Billion) Forecast, by Technology Type, 2016-2027

Table 45:  North America Automotive Smart Display Market (Thousand Units) Forecast, by LCD, 2016-2027

Table 46:  North America Automotive Smart Display Market Revenue (USD Billion) Forecast, by LCD, 2016-2027

Table 47:  North America Automotive Smart Display Market (Thousand Units) Forecast, by TFT-LCD, 2016-2027

Table 48:  North America Automotive Smart Display Market Revenue (USD Billion) Forecast, by TFT-LCD, 2016-2027

Table 49:  North America Automotive Smart Display Market (Thousand Units) Forecast, by Others, 2016-2027

Table 50:  North America Automotive Smart Display Market Revenue (USD Billion) Forecast, by Others, 2016-2027

Table 51:  North America Automotive Smart Display Market (Thousand Units) Forecast, by Application Type, 2016-2027

Table 52:  North America Automotive Smart Display Market Revenue (USD Billion) Forecast, by Application Type, 2016-2027

Table 53:  North America Automotive Smart Display Market (Thousand Units) Forecast, by Center Stack, 2016-2027

Table 54:  North America Automotive Smart Display Market Revenue (USD Billion) Forecast, by Center Stack, 2016-2027

Table 55:  North America Automotive Smart Display Market (Thousand Units) Forecast, by Headup Display, 2016-2027

Table 56:  North America Automotive Smart Display Market Revenue (USD Billion) Forecast, by Headup Display, 2016-2027

Table 57:  North America Automotive Smart Display Market (Thousand Units) Forecast, by Digital Instrumental Cluster, 2016-2027

Table 58:  North America Automotive Smart Display Market Revenue (USD Billion) Forecast, by Digital Instrumental Cluster, 2016-2027

Table 59:  North America Automotive Smart Display Market (Thousand Units) Forecast, by Rear Seat Entertainment, 2016-2027

Table 60:  North America Automotive Smart Display Market Revenue (USD Billion) Forecast, by Rear Seat Entertainment, 2016-2027

Table 61:  North America Automotive Smart Display Market (Thousand Units) Forecast, by Vehicle Type, 2016-2027

Table 62:  North America Automotive Smart Display Market Revenue (USD Billion) Forecast, by Vehicle Type, 2016-2027

Table 63:  North America Automotive Smart Display Market (Thousand Units) Forecast, by Passenger Cars Type, 2016-2027

Table 64:  North America Automotive Smart Display Market Revenue (USD Billion) Forecast, by Passenger Cars Type, 2016-2027

Table 65:  North America Automotive Smart Display Market (Thousand Units) Forecast, by Commercial Vehicles Type, 2016-2027

Table 66:  North America Automotive Smart Display Market Revenue (USD Billion) Forecast, by Commercial Vehicles Type, 2016-2027

Table 67:  North America Automotive Smart Display Market (Thousand Units) Forecast, by Country, 2016-2027

Table 68:  North America Automotive Smart Display Market Revenue (USD Billion) Forecast, by Country, 2016-2027

Table 69:  Europe Automotive Smart Display Market (Thousand Units) Forecast, by Size Type, 2016-2027

Table 70:  Europe Automotive Smart Display Market Revenue (USD Billion) Forecast, by Size Type, 2016-2027

Table 71:  Europe Automotive Smart Display Market (Thousand Units) Forecast, by 3"-5", 2016-2027

Table 72:  Europe Automotive Smart Display Market Revenue (USD Units) Forecast, by 3"-5", 2016-2027

Table 73:  Europe Automotive Smart Display Market (Thousand Units) Forecast, by 6"-10", 2016-2027

Table 74:  Europe Automotive Smart Display Market Revenue (USD Billion) Forecast, by 6"-10", 2016-2027

Table 75:  Europe Automotive Smart Display Market (Thousand Units) Forecast, by >10", 2016-2027

Table 76:  Europe Automotive Smart Display Market Revenue (USD Billion) Forecast, by >10", 2016-2027

Table 77:  Europe Automotive Smart Display Market (Thousand Units) Forecast, by Technology Type, 2016-2027

Table 78:  Europe Automotive Smart Display Market Revenue (USD Billion) Forecast, by Technology Type, 2016-2027

Table 79:  Europe Automotive Smart Display Market (Thousand Units) Forecast, by LCD, 2016-2027

Table 80:  Europe Automotive Smart Display Market Revenue (USD Billion) Forecast, by LCD, 2016-2027

Table 81:  Europe Automotive Smart Display Market (Thousand Units) Forecast, by TFT-LCD, 2016-2027

Table 82:  Europe Automotive Smart Display Market Revenue (USD Billion) Forecast, by TFT-LCD, 2016-2027

Table 83:  Europe Automotive Smart Display Market (Thousand Units) Forecast, by Others, 2016-2027

Table 84:  Europe Automotive Smart Display Market Revenue (USD Billion) Forecast, by Others, 2016-2027

Table 85:  Europe Automotive Smart Display Market (Thousand Units) Forecast, by Application Type, 2016-2027

Table 86:  Europe Automotive Smart Display Market Revenue (USD Billion) Forecast, by Application Type, 2016-2027

Table 87:  Europe Automotive Smart Display Market (Thousand Units) Forecast, by Center Stack, 2016-2027

Table 88:  Europe Automotive Smart Display Market Revenue (USD Billion) Forecast, by Center Stack, 2016-2027

Table 89:  Europe Automotive Smart Display Market (Thousand Units) Forecast, by Headup Display, 2016-2027

Table 90:  Europe Automotive Smart Display Market Revenue (USD Billion) Forecast, by Headup Display, 2016-2027

Table 91:  Europe Automotive Smart Display Market (Thousand Units) Forecast, by Digital Instrumental Cluster, 2016-2027

Table 92:  Europe Automotive Smart Display Market Revenue (USD Billion) Forecast, by Digital Instrumental Cluster, 2016-2027

Table 93:  Europe Automotive Smart Display Market (Thousand Units) Forecast, by Rear Seat Entertainment, 2016-2027

Table 94:  Europe Automotive Smart Display Market Revenue (USD Billion) Forecast, by Rear Seat Entertainment, 2016-2027

Table 95:  Europe Automotive Smart Display Market (Thousand Units) Forecast, by Vehicle Type, 2016-2027

Table 96:  Europe Automotive Smart Display Market Revenue (USD Billion) Forecast, by Vehicle Type, 2016-2027

Table 97:  Europe Automotive Smart Display Market (Thousand Units) Forecast, by Passenger Cars Type, 2016-2027

Table 98:  Europe Automotive Smart Display Market Revenue (USD Billion) Forecast, by Passenger Cars Type, 2016-2027

Table 99:  Europe Automotive Smart Display Market (Thousand Units) Forecast, by Commercial Vehicles Type, 2016-2027

Table 100:  Europe Automotive Smart Display Market Revenue (USD Billion) Forecast, by Commercial Vehicles Type, 2016-2027

Table 101:  Europe Automotive Smart Display Market (Thousand Units) Forecast, by Country, 2016-2027

Table 102:  Europe Automotive Smart Display Market Revenue (USD Billion) Forecast, by Country, 2016-2027

Table 103:  Asia Pacific Automotive Smart Display Market (Thousand Units) Forecast, by Size Type, 2016-2027

Table 104:  Asia Pacific Automotive Smart Display Market Revenue (USD Billion) Forecast, by Size Type, 2016-2027

Table 105:  Asia Pacific Automotive Smart Display Market (Thousand Units) Forecast, by 3"-5", 2016-2027

Table 106:  Asia Pacific Automotive Smart Display Market Revenue (USD Units) Forecast, by 3"-5", 2016-2027

Table 107:  Asia Pacific Automotive Smart Display Market (Thousand Units) Forecast, by 6"-10", 2016-2027

Table 108:  Asia Pacific Automotive Smart Display Market Revenue (USD Billion) Forecast, by 6"-10", 2016-2027

Table 109:  Asia Pacific Automotive Smart Display Market (Thousand Units) Forecast, by >10", 2016-2027

Table 110:  Asia Pacific Automotive Smart Display Market Revenue (USD Billion) Forecast, by >10", 2016-2027

Table 111:  Asia Pacific Automotive Smart Display Market (Thousand Units) Forecast, by Technology Type, 2016-2027

Table 112:  Asia Pacific Automotive Smart Display Market Revenue (USD Billion) Forecast, by Technology Type, 2016-2027

Table 113:  Asia Pacific Automotive Smart Display Market (Thousand Units) Forecast, by LCD, 2016-2027

Table 114:  Asia Pacific Automotive Smart Display Market Revenue (USD Billion) Forecast, by LCD, 2016-2027

Table 115:  Asia Pacific Automotive Smart Display Market (Thousand Units) Forecast, by TFT-LCD, 2016-2027

Table 116:  Asia Pacific Automotive Smart Display Market Revenue (USD Billion) Forecast, by TFT-LCD, 2016-2027

Table 117:  Asia Pacific Automotive Smart Display Market (Thousand Units) Forecast, by Others, 2016-2027

Table 118:  Asia Pacific Automotive Smart Display Market Revenue (USD Billion) Forecast, by Others, 2016-2027

Table 119:  Asia Pacific Automotive Smart Display Market (Thousand Units) Forecast, by Application Type, 2016-2027

Table 120:  Asia Pacific Automotive Smart Display Market Revenue (USD Billion) Forecast, by Application Type, 2016-2027

Table 121:  Asia Pacific Automotive Smart Display Market (Thousand Units) Forecast, by Center Stack, 2016-2027

Table 122:  Asia Pacific Automotive Smart Display Market Revenue (USD Billion) Forecast, by Center Stack, 2016-2027

Table 123:  Asia Pacific Automotive Smart Display Market (Thousand Units) Forecast, by Headup Display, 2016-2027

Table 124:  Asia Pacific Automotive Smart Display Market Revenue (USD Billion) Forecast, by Headup Display, 2016-2027

Table 125:  Asia Pacific Automotive Smart Display Market (Thousand Units) Forecast, by Digital Instrumental Cluster, 2016-2027

Table 126:  Asia Pacific Automotive Smart Display Market Revenue (USD Billion) Forecast, by Digital Instrumental Cluster, 2016-2027

Table 127:  Asia Pacific Automotive Smart Display Market (Thousand Units) Forecast, by Rear Seat Entertainment, 2016-2027

Table 128:  Asia Pacific Automotive Smart Display Market Revenue (USD Billion) Forecast, by Rear Seat Entertainment, 2016-2027

Table 129:  Asia Pacific Automotive Smart Display Market (Thousand Units) Forecast, by Vehicle Type, 2016-2027

Table 130:  Asia Pacific Automotive Smart Display Market Revenue (USD Billion) Forecast, by Vehicle Type, 2016-2027

Table 131:  Asia Pacific Automotive Smart Display Market (Thousand Units) Forecast, by Passenger Cars Type, 2016-2027

Table 132:  Asia Pacific Automotive Smart Display Market Revenue (USD Billion) Forecast, by Passenger Cars Type, 2016-2027

Table 133:  Asia Pacific Automotive Smart Display Market (Thousand Units) Forecast, by Commercial Vehicles Type, 2016-2027

Table 134:  Asia Pacific Automotive Smart Display Market Revenue (USD Billion) Forecast, by Commercial Vehicles Type, 2016-2027

Table 135:  Asia Pacific Automotive Smart Display Market (Thousand Units) Forecast, by Country, 2016-2027

Table 136:  Asia Pacific Automotive Smart Display Market Revenue (USD Billion) Forecast, by Country, 2016-2027

Table 137:  Rest of the World Automotive Smart Display Market (Thousand Units) Forecast, by Size Type, 2016-2027

Table 138:  Rest of the World Automotive Smart Display Market Revenue (USD Billion) Forecast, by Size Type, 2016-2027

Table 139:  Rest of the World Automotive Smart Display Market (Thousand Units) Forecast, by 3"-5", 2016-2027

Table 140:  Rest of the World Automotive Smart Display Market Revenue (USD Units) Forecast, by 3"-5", 2016-2027

Table 141:  Rest of the World Automotive Smart Display Market (Thousand Units) Forecast, by 6"-10", 2016-2027

Table 142:  Rest of the World Automotive Smart Display Market Revenue (USD Billion) Forecast, by 6"-10", 2016-2027

Table 143:  Rest of the World Automotive Smart Display Market (Thousand Units) Forecast, by >10", 2016-2027

Table 144:  Rest of the World Automotive Smart Display Market Revenue (USD Billion) Forecast, by >10", 2016-2027

Table 145:  Rest of the World Automotive Smart Display Market (Thousand Units) Forecast, by Technology Type, 2016-2027

Table 146:  Rest of the World Automotive Smart Display Market Revenue (USD Billion) Forecast, by Technology Type, 2016-2027

Table 147:  Rest of the World Automotive Smart Display Market (Thousand Units) Forecast, by LCD, 2016-2027

Table 148:  Rest of the World Automotive Smart Display Market Revenue (USD Billion) Forecast, by LCD, 2016-2027

Table 149:  Rest of the World Automotive Smart Display Market (Thousand Units) Forecast, by TFT-LCD, 2016-2027

Table 150:  Rest of the World Automotive Smart Display Market Revenue (USD Billion) Forecast, by TFT-LCD, 2016-2027

Table 151:  Rest of the World Automotive Smart Display Market (Thousand Units) Forecast, by Others, 2016-2027

Table 152:  Rest of the World Automotive Smart Display Market Revenue (USD Billion) Forecast, by Others, 2016-2027

Table 153:  Rest of the World Automotive Smart Display Market (Thousand Units) Forecast, by Application Type, 2016-2027

Table 154:  Rest of the World Automotive Smart Display Market Revenue (USD Billion) Forecast, by Application Type, 2016-2027

Table 155:  Rest of the World Automotive Smart Display Market (Thousand Units) Forecast, by Center Stack, 2016-2027

Table 156:  Rest of the World Automotive Smart Display Market Revenue (USD Billion) Forecast, by Center Stack, 2016-2027

Table 157:  Rest of the World Automotive Smart Display Market (Thousand Units) Forecast, by Headup Display, 2016-2027

Table 158:  Rest of the World Automotive Smart Display Market Revenue (USD Billion) Forecast, by Headup Display, 2016-2027

Table 159:  Rest of the World Automotive Smart Display Market (Thousand Units) Forecast, by Digital Instrumental Cluster, 2016-2027

Table 160:  Rest of the World Automotive Smart Display Market Revenue (USD Billion) Forecast, by Digital Instrumental Cluster, 2016-2027

Table 161:  Rest of the World Automotive Smart Display Market (Thousand Units) Forecast, by Rear Seat Entertainment, 2016-2027

Table 162:  Rest of the World Automotive Smart Display Market Revenue (USD Billion) Forecast, by Rear Seat Entertainment, 2016-2027

Table 163:  Rest of the World Automotive Smart Display Market (Thousand Units) Forecast, by Vehicle Type, 2016-2027

Table 164:  Rest of the World Automotive Smart Display Market Revenue (USD Billion) Forecast, by Vehicle Type, 2016-2027

Table 165:  Rest of the World Automotive Smart Display Market (Thousand Units) Forecast, by Passenger Cars Type, 2016-2027

Table 166:  Rest of the World Automotive Smart Display Market Revenue (USD Billion) Forecast, by Passenger Cars Type, 2016-2027

Table 167:  Rest of the World Automotive Smart Display Market (Thousand Units) Forecast, by Commercial Vehicles Type, 2016-2027

Table 168:  Rest of the World Automotive Smart Display Market Revenue (USD Billion) Forecast, by Commercial Vehicles Type, 2016-2027

  • Jan, 2021
  • 2019
  • 2016-2018
  • 200

    CHOOSE LICENSE TYPE

  • $4850
    $5850
    $6850

Personalize this Research

  • Granular Research on Specified Regions or Segments
  • Companies Profiled based on User Requirement
  • Broader Insights Pertaining to a Specific Segment or Region
  • Breaking Down Competitive Landscape as per Your Requirement
  • Other Specific Requirement on Customization
Request Customization Banner

Automotive & Transportation Clients

GM
Asahi
Toshiba
Hitachi
Deloitee

Client Testimonials

“This report is really well done and we really appreciate it! Again, I may have questions as we dig in deeper. Thanks again for some really good work.”

- U.S.-based biotechnology company focussing on treatment of chronic pain.

“Kudos to your team. Thank you very much for your support and agility to answer our questions.”

- Europe-based provider of solutions to automate data centre operations.

“We appreciate you and your team taking out time to share the report and data file with us, and we are grateful for the flexibility provided to modify the document as per request. This does help us in our business decision making. We would be pleased to work with you again, and hope to continue our business relationship long into the future.”

- India-based manufacturer of industrial and specialty intermediates with a strong global presence.

“I want to first congratulate you on the great work done on the Medical Platforms project. Thank you so much for all your efforts.”

- One of the largest cosmetics company in the world.

“Thank you very much. I really appreciate the work your team has done. I feel very comfortable recommending your services to some of the other startups that I’m working with, and will likely establish a good long partnership with you.”

- U.S. based startup operating in the cultivated meat market.

“We received the below report on the U.S. market from you. We were very satisfied with the report.”

- UGlobal hearing aids manufacturer.

“I just finished my first pass-through of the report. Great work! Thank you!”

- U.S. based solar racking solutions provider.

“Thanks again for the great work on our last partnership. We are ramping up a new project to understand the imaging and imaging service and distribution market in the U.S.”

- World’s leading advisory firm.

“We feel positive about the results. Based on the presented results, we will do strategic review of this new information and might commission a detailed study on some of the modules included in the report after end of the year. Overall we are very satisfied and please pass on the praise to the team. Thank you for the co-operation!”

- Germany based machine construction company.

“Thank you very much for the very good report. I have another requirement on cutting tools, paper crafts and decorative items.”

- Japanese manufacturing company of stationery products.

“We are happy with the professionalism of your in-house research team as well as the quality of your research reports. Looking forward to work together on similar projects”

- One of the Leading Food Companies in Germany

“We appreciate the teamwork and efficiency for such an exhaustive and comprehensive report. The data offered to us was exactly what we were looking for. Thank you!”

- Intuitive Surgical

“I recommend Fortune Business Insights for their honesty and flexibility. Not only that they were very responsive and dealt with all my questions very quickly but they also responded honestly and flexibly to the detailed requests from us in preparing the research report. We value them as a research company worthy of building long-term relationships.”

- Major Food Company in Japan

“Well done Fortune Business Insights! The report covered all the points and was very detailed. Looking forward to work together in the future”

- Ziering Medical

“It has been a delightful experience working with you guys. Thank you Fortune Business Insights for your efforts and prompt response”

- Major Manufacturer of Precision Machine Parts in India

“I had a great experience working with Fortune Business Insights. The report was very accurate and as per my requirements. Very satisfied with the overall report as it has helped me to build strategies for my business”

- Hewlett-Packard

“This is regarding the recent report I bought from Fortune Business insights. Remarkable job and great efforts by your research team. I would also like to thank the back end team for offering a continuous support and stitching together a report that is so comprehensive and exhaustive”

- Global Management Consulting Firm

“Please pass on our sincere thanks to the whole team at Fortune Business Insights. This is a very good piece of work and will be very helpful to us going forward. We know where we will be getting business intelligence from in the future.”

- UK-based Start-up in the Medical Devices Sector

“Thank you for sending the market report and data. It looks quite comprehensive and the data is exactly what I was looking for. I appreciate the timeliness and responsiveness of you and your team.”

- One of the Largest Companies in the Defence Industry
We use cookies to enhance your experience. By continuing to visit this site you agree to our use of cookies . Privacy.
X