Graph Database Market Size, Share & Industry Analysis, By Database Type (Property Graph and RDF Graph), By Deployment (On-Premise, Cloud, and Hybrid), By Application (Social Network, Fraud Detection, Recommendation Systems, Knowledge Graphs, Supply Chain and Logistics, Customer 360, and AI & Machine learning), By Industry (BFSI, Healthcare & Life Science, Retail & E-Commerce, IT & Telecom, Manufacturing, Energy & Utilities, Government, Media & Entertainment, and Others), and Regional Forecast, 2026-2034
GRAPH DATABASE MARKET SIZE AND FUTURE OUTLOOK
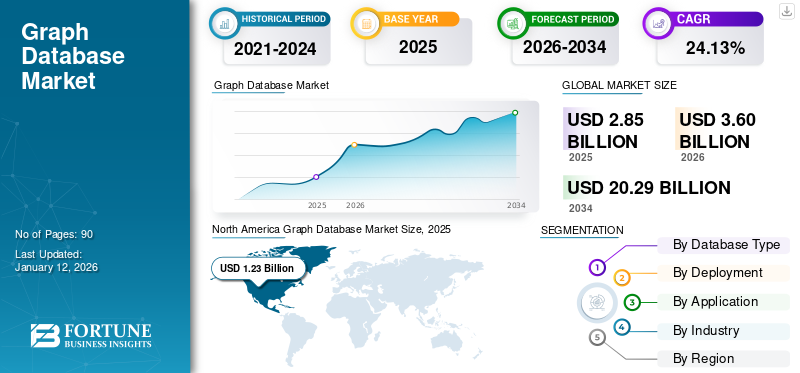
The global graph database market size was valued at USD 2.85 billion in 2025 and is projected to grow from USD 3.6 billion in 2026 to USD 20.29 billion by 2034, exhibiting a CAGR of 24.13% during the forecast period. North America dominated the graph database market with a market share of 43.02% in 2025.
A graph database is a specialized single-purpose platform for managing and creating graphs. These graphs consist of edges, nodes, and properties, which are utilized to store and represent data in a manner that relational databases are not optimized to handle.
As a part of their growth strategy, companies such as Neo4j, Oracle Corporation, and Amazon Web Services are focusing on product innovation, industry-specific solutions, and open-source and community-driven initiatives to expand their business and geographical footprint.
Download Free sample to learn more about this report.
IMPACT OF GENERATIVE AI
Integration of Product with Gen-AI Technologies to Boost Market Development
The rising awareness of Gen-AI has a significant impact on the market due to its capabilities and features. The integration of graph databases with artificial intelligence (AI) has resulted in innovative solutions, mainly in fields that require complex data analysis and modeling. Gen-AI technologies, such as natural language processing and machine learning, boost the capability of graph databases to predict and recognize patterns within interconnected and large datasets. For instance,
- Neo4j’s GraphRAG is a unique approach that helps in improving GenAI application performance. It combines knowledge graphs with RAG (retrieval-augmented generation) to enable faster and more effective development of enterprise-grade GenAI applications.
MARKET DYNAMICS
Market Drivers
Growing Volume and Complexity of Data to Drive the Expansion of the Market
The rising complexity and volume of data are driving demand for sophisticated data management solutions, such as graph databases. Traditional databases frequently struggle to handle interconnected and complex data structures, denoting graph databases as a crucial solution for organizations aiming to get data from intricate and vast datasets. For instance,
- As per Industry Analysis, the global data volume stands at 149 zettabytes, with 463 exabytes of data created every day.
- Another study showed that data volume will increase 150 times in 2027 compared to 97 ZB in 2022, and by 2032, this figure will increase 300 times compared to data collected by 2027.
Market Restraints
Limited Awareness and Understanding of Graph Database Can Restrict Graph Database Market Growth
Regardless of the growing interest in the graphic database, there remains a limited understanding of the value they provide. Many companies still do not know graphic technology and do not fully understand its potential, especially compared to traditional databases. This lack of awareness and understanding limits the application of graphic databases in many organizations, as companies may not recognize the advantages graphic databases provide in managing and analyzing complex, highly connected data.
Market Opportunities
Rising Usage of Artificial Intelligence (AI) Solutions to Boost Market Progress
The global graph database growth is being driven by the combination of artificial intelligence technologies (AI) across many business processes. Artificial intelligence to evaluate and explain large amounts of data necessitates robust, solid data management solutions as graph databases. For instance,
- As per Artificial Intelligence Statistics 2024, 35% of companies worldwide utilized AI to boost their business operations, while 42% of respondents stated that they are using AI for their company’s use.
- According to Industry Analysis 2024, Artificial Intelligence is helping automate 40% of the average workday, highlighting its role in enabling data-driven and strategic decisions.
Graph databases are being used by companies such as IBM and Google to support sophisticated artificial intelligence algorithms, leveraging the technology to improve data connections and strengthen predictive analytics.
GRAPH DATABASE MARKET TRENDS
Increased Adoption of Cloud Native Solutions is Considered to be a Significant Graph Database Market Trend
The application of cloud technology continues to be an important factor in the growth of the graphic database market. Cloud-based database solutions offer scalability, reduce infrastructure costs, simplify the management of large data sets. For instance,
- Amazon Neptune and Azure Cosmos DB are managed graphic databases that allow organizations to deploy and operate graphic databases in the cloud without managing the underlying infrastructure.
- E-commerce platforms use cloud solutions to manage complex recommendations and customer relations in some areas, allowing faster expansion when the demand increases.
As a result, cloud-based graph databases are gaining significant traction owing to their cost-effectiveness, scalability, real-time data processing, enhanced security, global accessibility, and seamless incorporation with other cloud services. These features are reshaping the market by creating graph databases more reachable to businesses of all sizes across industries such as IT & telecom, finance, retail, and healthcare.
SEGMENTATION ANALYSIS
By Database Type
Property Graph Segment Dominated due to Real-time Relationship Analysis
Based on database type, the market is divided into a property graph and RDF graph.
The property graph segment will account for 56.46% market share in 2026. Property graphs are increasingly being utilized in real-world data analytics applications where it is critical to identify complex anomalies and patterns. Their ability to represent relationships between entities in real time permits businesses to complete fast analyses on large datasets. For instance,
- Paypal uses real estate graphics in fraud detection systems to monitor millions of actual transactions. Paypal can quickly identify suspicious models and prevent fraud activities by analyzing the properties of relationships between accounts, users, and transactions.
RDF (Resource Description Framework) is anticipated to grow at the highest CAGR during the forecast period. Its growth will be driven by multiple factors, including the increase in web technologies, the rising need for data integration, and the significance of real-time machine learning and AI applications.
By Deployment
Cloud Segment led due to Portfolio Transformation by Key Players
Based on deployment, the market is divided into cloud, on-premise, and hybrid.
Cloud captured the largest market share in 2026 and is anticipated to grow at a highest CAGR during the forecast period. The transformation of cloud portfolios by key players in the graph database market is driving significant growth and innovation. These companies are enhancing their cloud offerings by integrating new technologies, improving scalability, and making their solutions more accessible and flexible. The Cloud-deployment segment is expected to account for 73.83% of the market in 2026. For instance,
- Neo4j, a Graph analytics and database provider, announced the transformation of its Aura cloud database management system portfolio. The portfolio helps enterprises to try with, build, and quickly graph deployments in production for any workload or use case.
By Application
Social Networks Segment Dominated owing to Adoption of Property Graph Models by Platforms
Based on application, the market is divided into social networks, fraud detection, recommendation systems, knowledge graphs, supply chain and logistics, customer 360, and AI & machine learning.
The social networks segment is expected to lead the market, contributing 23.11% globally in 2026. Social networks include multi-level and complicated relations between entities such as posts, users, likes, comments, and teams. Graph databases facilitate efficient analysis and querying of these connections, thereby boosting segment growth. For instance,
- Facebook utilized a property graph model to signify relationships among pages, users, groups, comments, and posts.
AI & ML is anticipated to grow at a highest CAGR of 35.59% during the forecast period owing to their ability to model complex relations, enhanced data enrichment, and support advanced feature engineering.
To know how our report can help streamline your business, Speak to Analyst
By Industry
Rising Concern over False Activities Encouraged the BFSI Segment Growth
Based on industry, the market is fragmented into BFSI, healthcare & life science, retail & E-commerce, IT & telecom, manufacturing, energy & utilities, government, media & entertainment, and others.
BFSI held a majority market share in 2026 owing to increasing concerns over fraudulent activities such as credit card fraud, money laundering, and identity theft. The growing need for predictive analytics and real-time detection is pushing the adoption of graph databases, which are highly effective in analyzing and modeling complex relationships.
The healthcare & life science segment is anticipated to hold a dominant market share of 25.96% in 2026, and grow at the highest CAGR of 31.08% during the forecast period. In healthcare, graph databases are used for drug discovery, patient data analysis, and disease mapping. Their ability to represent complex biological and patient relationship networks makes them especially valuable for deriving actionable insights and improving outcomes.
GRAPH DATABASE MARKET REGIONAL OUTLOOK
By region, the market is studied across North America, Asia Pacific, Europe, the Middle East & Africa, and South America.
North America
North America Graph Database Market Size, 2025 (USD Billion)
To get more information on the regional analysis of this market, Download Free sample
North America maintained a strong presence in the global market, reaching USD 1.23 billion in 2025, accounting for 43.02% share, and is expected to reach USD 1.56 billion in 2026. The market is gaining traction in North America owing to the region's leadership in the utilization and adoption of database technologies. This domination is supported by a mature ecosystem for data management solutions, a strong presence of tech-driven industries, and rising recognition among companies of the values of relationship-centric data modeling.
Download Free sample to learn more about this report.
The U.S. market is expected to hit USD 1.16 billion in 2026. The rapid evolution of technologies, such as AI/ML models for applications such as demand forecasting, predictive analytics, and customer behavior analysis, is accelerating the adoption of the product in industries such as healthcare, finance, and retail.
Europe
In 2025, Europe generated USD 0.76 billion, contributing 26.79% to global market revenue, and is projected to grow to USD 0.95 billion in 2026, while the adoption of graph databases is strong in sectors such as healthcare, government, and BFSI. Additionally, the region’s stringent data protection regulations, such as the GDPR, are prompting organizations to manage interconnected data using graph databases carefully. The U.K. market is expected to hit USD 0.26 billion in 2026. The market value in Germany is projected to gain USD 0.23 billion in 2026. France to likely hit USD 0.13 billion in 2025.
Asia Pacific
The Asia Pacific market accounted for USD 0.57 billion in 2025, representing 20.05% of the global industry, and is expected to reach USD 0.74 billion in 2026. The region's fast economic development, mainly in countries such as India, China, Japan, and Southeast Asian nations, is fueling the adoption of the product to handle interconnected and complex data in multiple industries such as e-commerce, finance, government, and telecommunications. For instance,
- Tencent in China uses graph databases to form knowledge graphs that increase their artificial intelligence abilities in areas such as gaming, social media, and financial services.
The market in China is anticipated to hit USD 0.26 billion in 2026, while the Indian market is likely to reach USD 0.17 billion and Japan most likely to hit USD 0.17 billion in 2026.
Middle East & Africa
In 2025, Middle East & Africa represented USD 0.1 billion, accounting for 3.62% of the worldwide market, and is projected to grow to USD 0.12 billion in 2026. The Middle East & Africa region is witnessing considerable demand for database technologies. Companies in the Middle East & Africa are looking to maximize the value of their databases by utilizing and restructuring data, which contributes to the region’s market growth. The GCC market is projected to hold USD 0.05 billion in 2025.
South America
In South America, the market is driven by businesses migrating to cloud solutions and consolidating databases. These efforts generate a significant amount of revenue that requires properly structured databases, thereby boosting market demand in the region. South America is expected to hold the fourth-largest market with a value of USD 0.19 billion in 2025.
Latin America
Latin America contributed 6.52% to the global market in 2025, with a valuation of USD 0.19 billion, and is projected to reach USD 0.23 billion in 2026.
Competitive Landscape
KEY INDUSTRY PLAYERS
Key Players Focus on Collaborations to Strengthen their Competitive Position
Key players in the market are pursuing strategic acquisitions, forming partnerships, and developing comprehensive graph database solutions to boost their competitive position and expand market share. These strategies are helping organizations meet the growing demand for connected data management and analytics while also addressing critical challenges such as data security, compliance, and scalability.
List Of Key Graph Database Companies Studied
- Neo4j (U.S.)
- Amazon Web Services (U.S.)
- Microsoft Corporation (U.S.)
- TigerGraph (U.S.)
- Oracle Corporation (U.S.)
- ArangoDB (Germany)
- GraphDB (Bulgaria)
- Cayley (Germany)
- DataStax (U.S.)
- BlazeGraph (U.S.)
- OrientDB (Italy)
- GrapheneDB (Spain)
- Fractal Analytics (India)
- SAP SE (Germany)
- Google LLC (U.S.)
- AllegroGraph (U.S.)
- Zylotech (India)
- Mindfire Solution (India)
- CureMetrix (India)
and others…
KEY INDUSTRY DEVELOPMENTS
- June 2025- AWS launched Amazon Neptune Analytics, joining graph processing with analytics capabilities, making it easier to develop insights from graph-based data.
- November 2024- Neo4j surpassed USD 200M in revenue, solidifying leadership in GenAI-driven graph technology.
- September 2024- Neo4j announced a key transformation of its Aura cloud database management system portfolio, making it easier for enterprises to try, accelerate, and deploy graph databases in production for any use case or workload.
- August 2024- Google launched Spanner Graph, a unified database that integrates graphs, AI, and relational capabilities, aimed at enhancing comprehensive analytics and improving use cases such as recommendation engines and fraud detection.
- March 2024- Microsoft introduced Neo4j AuraDB with an integrated generative AI console and interactive dashboard-building tools, allowing businesses to deploy graph-based solutions with AI-enhanced features seamlessly.
INVESTMENT ANALYSIS AND OPPORTUNITIES
Investment in cloud-native solutions represents one of the largest growth opportunities in the graph database market. Companies are increasingly investing in cloud-based graph database services, which offer greater scalability, flexibility, and lower operational costs compared to on-premise systems. This trend presents investors with a significant opportunity to capitalize on the growing demand for managed services and SaaS-based graph database solutions that can scale with enterprise needs. Additionally, many cloud platforms often offer pay-as-you-go models, making graph databases more accessible to a wide range of businesses.
REPORT COVERAGE
The report provides a detailed analysis of the market and focuses on key aspects such as leading companies, service types, and leading applications of the product. Besides, the report offers insights into the market trends and highlights key industry developments. In addition to the factors above, the report encompasses several factors that contributed to the growth of the market in recent years.
Request for Customization to gain extensive market insights.
REPORT SCOPE & SEGMENTATION
|
Study Period |
2021-2034 |
|
Base Year |
2025 |
|
Forecast Period |
2026-2034 |
|
Historical Period |
2021-2024 |
|
Growth Rate |
CAGR of 24.13% from 2026 to 2034 |
|
Unit |
Value (USD Billion) |
|
Segmentation |
By Database Type, Deployment, Application, Industry, and Region |
|
Segmentation |
By Database Type
By Deployment
By Application
By Industry
By Region
|
|
Companies Profiled in the Report |
|
Frequently Asked Questions
The market is projected to reach USD 20.29 billion by 2034.
In 2025, the market was valued at USD 2.85 billion.
The market is projected to grow at a CAGR of 24.13% during the forecast period.
By industry, the BFSI segment led the market.
The growing volume and complexity of data a key factor driving the expansion of the market
Neo4j, Amazon Web Services, Microsoft Corporation, and TigerGraph are the top players in the market.
North America is expected to hold the highest market share.


- 2021-2034
- 2025
- 2021-2024
- 90
Get 30-60 hrs Free Customization
Expand Regional and Country Coverage, Segments Analysis, Company Profiles, Competitive Benchmarking, and End-user Insights.
Related Reports
-
US +1 833 909 2966 ( Toll Free )
-
Get In Touch With Us