Polyurethane Market Size, Share & Industry Analysis, By Product Type (Rigid Foam, Flexible Foam, Molded Foam, Elastomers, Adhesives & Sealants, Coatings, and Others), By Application (Furniture, Construction, Electronics, Automotive, Packaging, Footwear, and Others), and Regional Forecast, 2026-2034
KEY MARKET INSIGHTS
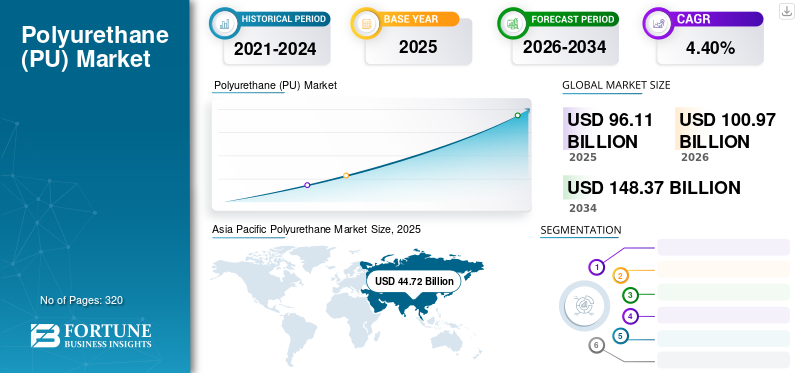
The global polyurethane market size was valued at USD 96.11 billion in 2025 and is projected to grow from USD 100.97 billion in 2026 to USD 148.37 billion by 2034, exhibiting a CAGR of 4.4% during the forecast period. Asia Pacific dominated the polyurethane market with a market share of 46.50% in 2025. Moreover, the polyurethane market size in the U.S. is projected to grow significantly, reaching an estimated value of USD 26.07 billion by 2032, driven by rising demand for smart polyurethane foam from the automotive industry.
Polyurethane (PU or PUR) is a polymer with links of polyols and isocyanate sequenced in an alternate method. It is formed by the reaction between polyols and isocyanate. It has two types: thermosetting polymer and thermoplastic polymer. It is widely used in manufacturing gaskets, elastomers, high-performance adhesives, surface coating, and synthetic fibers. In addition, the increasing use of innovative production technologies with advanced features is anticipated to impact the market positively. For example, the development of TPU and PU acrylate oligomers blended and radiation-cured to achieve semi-interpenetrating polymer networks (IPN).
Disruption in manufacturing activities caused hindrances in the production of raw materials for polymers across the globe due to the COVID-19 pandemic. This impacted the end-user industries and other parallel activities. Several isocyanate and polyol orders were cancelled and postponed, resulting in production outages. The low demand from the end-use industries due to COVID-19 had a negative impact on the market growth during the period. Moreover, in June 2022, the prices plunged to new lows due to a slow recovery and uncertainty. The reduced consumption took a huge toll on the business scenario.
Download Free sample to learn more about this report.
Global Polyurethane Market Key Takeaways
Market Size & Forecast:
- 2025 Market Size: USD 96.11 billion
- 2026 Market Size: USD 100.97 billion
- 2034 Forecast Market Size: USD 148.37 billion
- CAGR: 4.4% from 2026–2034
Market Share:
- Asia Pacific dominated the polyurethane market with a 46.50% share in 2025, driven by high demand from the construction and furniture industries, especially in China.
- By product type, Flexible Foam held the largest share in 2023 due to its extensive use in furniture, bedding, and specialty packaging applications.
Key Country Highlights:
- United States: The polyurethane market is projected to reach USD 26.07 billion by 2032, supported by growing demand for smart PU foam in automotive applications, offering sound and heat insulation in components like seats, door trims, and gear knobs.
- China: Leads the Asia Pacific region in polyurethane consumption due to expansion in the construction and furniture sectors, contributing significantly to the region’s market dominance.
- Europe: Expected to witness substantial growth driven by rising production of polyurethane for machinery and furniture applications, especially in Germany and France.
- Brazil & Saudi Arabia: Both countries are driving demand in South America and the Middle East & Africa, respectively, with polyurethane widely used in insulation and furniture manufacturing.
Polyurethane Market Trends
Rising Adoption of Higher Quality PU Coating and Adhesives in the Construction Industry
PU adhesives are durable, flexible, and have better bonding and impact resistance. This product type is typically used in vehicle interiors to bond windshields, seal fuel tanks, and residential buildings & construction applications. High demand for adhesives from construction projects is expected to be one of the leading market trends.
PU coatings protect the substrate from abrasion, corrosion, and weathering. These coatings adhere to a great extent to the base material. Increasing demand for PU coatings from the automotive, construction, and furniture industries will propel the polyurethane market growth.
Download Free sample to learn more about this report.
Polyurethane Market Growth Factors
Increasing Demand for Foams from the Furniture Industry to Fuel Market Growth
The product is majorly used as a foam in the furniture industry for bedding and cushioning applications. Its durability, flexible nature, and ability to provide comfort make it an ideal material for the furniture industry. Furniture demand is increasing rapidly around the globe due to the rising population and the changing lifestyle of people. This is anticipated to drive market growth globally.
The construction industry is experiencing a high demand for the housing sector worldwide. It is further surging the demand for furniture. The growing demand for chairs and sofas from the commercial sector is expected to support the demand for furniture in the construction industry. These factors will act as drivers for the market growth.
Rising Demand for Smart PU Foam from the Automotive Industry to Drive the Market
Polyurethane is the key raw material for the manufacturing of smart PU foam by using hydrothermal reduction and adsorption processes. Smart PU has gradually gained traction owing to its enhanced structural, chemical, and mechanical properties. The product offers better sound insulation and heat insulation for automobile components owing to the presence of materials such as carbon compounds in its formulation. These compounds help to achieve uniform particle structure and orientation and improve the viscosity and resistivity of the product. Such chemical properties of smart PU foams make them an appropriate material for automotive components such as wheels, seats, gear knobs, door trims, and others. Thus, the enhanced properties offered by the product are expected to drive the market.
RESTRAINING FACTORS
Strong Presence of Substitutes May Confine Market Growth
Polyurethane is a versatile material used in various end-use industries and applications. However, many substitutes available in the market would outplay the product in certain applications. For instance, linseed oil treats wood in the furniture industry instead of toxic products. Polysiloxane coatings are used instead of PUR coatings (based on isocyanates) in marine applications. Also, polysiloxane coatings' suitable durability and weathering properties for marine applications make them a healthy substitute for PUR coatings. This would confine the market growth.
Polyurethane Market Segmentation Analysis
By Product Type Analysis
Flexible Foam Segment to Account for Largest Share Backed by Usage in Furniture & Bedding
Based on product type, the market is segmented into rigid foam, flexible foam, molded foam, coatings, elastomers, adhesives & sealants, and others.
Amongst these, The flexible foam segment is expected to hold the largest market share, contributing 33.10% globally in 2026. owing to its increasing use in bedding and furniture applications. The growing use of flexible foam in specialty packaging for transporting goods and sealing is surging the demand for PU.
Rigid polyurethane foams are generally used for thermal insulation in various electronics and home appliances, such as refrigerators and air-conditioners. Hence, this segment is expected to grow with the rising electronics and appliance production.
Molded foam can be hammered or pressed into different shapes per the end user’s requirements. This type of foam is used in various industries such as agriculture, military, and automotive. It is also used for medical purposes, such as short-term implants and injection-molded devices. The above factors are expected to raise the demand for molded foam.
PU elastomer has characteristics similar to that of rubber. The properties offered by these elastomers include high elasticity, abrasion resistance, tear resistance, and chemical resistance. These properties make it suitable for footwear, construction application, wheels & tires, and machinery. The demand for elastomers from the automotive, construction, and footwear industries will be responsible for the segment's growth during the forecast period.
By Application Analysis
To know how our report can help streamline your business, Speak to Analyst
Furniture Segment to Exhibit a Significant CAGR Owing to Demand for Cushioning Effect
Based on application, the market is classified into construction, electronics, automotive, packaging, footwear, furniture, and others.
Amongst these,The furniture segment is expected to lead the market, contributing 27.09% globally in 2026. The furniture segment is expected to register the fastest growth rate during 2024-2032. In furniture applications, the PU foam is utilized for cushioning effect that offers durability and support. The product has showcased higher demand from the construction industry owing to the insulation effect, flame retardancy, and heat protection properties offered by it. The product is used as an adhesive & sealant for insulating walls and electronic items. In addition, it is used in the automotive industry to improvise the impact resistance in automobiles. Hence, the increased demand in building construction and automobile production will surge the market's growth.
The increase in packaging and footwear applications is linked with increased foam adoption in adhesive tapes and the sole of the footwear. They provide pressure and shock resistance to footwear and offer comfortable use of footwear. In addition to this, they are used as adhesive tapes and films in the packaging segment. Moreover, the product is used in other applications, including sports goods, textiles, and medical.
REGIONAL INSIGHTS
Asia Pacific Polyurethane Market Size, 2025 (USD Billion)
To get more information on the regional analysis of this market, Download Free sample
Asia Pacific
Asia Pacific dominated the market with a valuation of USD 44.72 billion in 2025 and is projected to reach USD 47.31 billion in 2026. Asia Pacific is expected to hold a major portion of the global polyurethane market share in terms of revenue and volume and is projected to exhibit significant growth. The increasing demand for applications in the furniture and construction industries will contribute to the market growth in this region. China accounted for the largest share within the region in 2025 and is expected to remain the largest in the market throughout the forecast period due to the expanding construction industry. The Japan polyurethane market is projected to reach USD 2.47 billion by 2026, the China polyurethane market is projected to reach USD 27.61 billion by 2026, and the India polyurethane market is projected to reach USD 2.28 billion by 2026.
To know how our report can help streamline your business, Speak to Analyst
North America
In 2025, North America represented USD 23.42 billion, accounting for 24.40% of the worldwide market, and is projected to grow to USD 24.4 billion in 2026. North America is expected to showcase considerable growth in the market. The leading country in the region, the U.S., uses this material in automotive and construction applications, which will aid the market growth. The U.S. polyurethane market is projected to reach USD 20.12 billion by 2026.
Europe
The Europe market generated USD 20.23 billion in 2025, representing 21.00% of the global market landscape, and is expected to reach USD 21.2 billion in 2026. Europe will exhibit substantial growth owing to increasing polyurethane production for machinery and furniture application. These will further help in surging the value of this market in the region. The UK polyurethane market is projected to reach USD 1.94 billion by 2026, while the Germany polyurethane market is projected to reach USD 6.1 billion by 2026.
South America
In South America, the increasing demand from the construction industry is a major factor driving market growth. Countries such as Brazil are key contributors, supported by rising adoption in applications such as furniture manufacturing and wall insulation. Expanding construction activities and infrastructure development are further boosting product demand across the region.
The market in Latin America reached USD 3.48 billion in 2025, representing 3.60% of total market revenue, and is projected to reach USD 3.62 billion in 2026.
Middle East & Africa
The Middle East & Africa market was valued at USD 4.26 billion in 2025, capturing 4.40% of global revenue, and is estimated to reach USD 4.45 billion in 2026. In the Middle East & Africa, market growth is primarily driven by rising construction activities, particularly in countries such as Saudi Arabia. The adoption of applications including furniture manufacturing and wall insulation is supporting demand. Additionally, other countries across the region are expected to grow at a significant CAGR during the forecast period, contributing to overall market expansion.
List of Key Companies in Polyurethane Market
Key Players to Strengthen their Positions by Offering Novel Solutions
The major producers of PUR are present in Asia Pacific, resulting in a fragmented market. Some of the key market players include BASF, Covestro AG, Yantai Wanhua Polyurethanes Co., Ltd., Huntsman, and Mitsui Chemicals & SKC Polyurethanes Inc. BASF is one of the leading providers of chemicals, material, and industrial solutions. The company also offers expertise in several industries such as furniture, construction, electronics, automotive & transportation, packaging, footwear, paints & coatings, and homecare & nutrition.
Covestro AG is among the leading suppliers of premium polymers. The company has a major presence in Europe. It used the partnership strategy with organizations and joined campaigns such as ‘Alliance to End Plastic Waste’ and ‘Circular Plastics Alliance’ to promote plastic recycling in Europe and increase awareness among people. Similarly, the other key players in this market have developed a strong regional presence, distribution channels, and product offerings.
LIST OF KEY COMPANIES PROFILED:
- BASF SE (Germany)
- The Dow Chemical Company (U.S.)
- Covestro AG (Germany)
- Yantai Wanhua Polyurethanes Co., Ltd. (China)
- Huntsman (U.S.)
- Foamcraft, Inc. (U.S.)
- Mitsui Chemicals & SKC Polyurethanes Inc. (South Korea)
- Lanxess (Germany)
- Eurofoam Group (Austria)
- Inoac Corporation (Japan)
KEY INDUSTRY DEVELOPMENTS:
- September 2023- Huntsman developed the first liquid thermoplastic polyurethane (LTPU) for the footwear industry. The product enables the high-speed manufacturing of athleisure and sports footwear compared to thermoplastic polyurethane. The purpose of the product development is to maximize the revenue from the plastic segment.
- February 2023- Huntsman announced the launch of a new polyurethane coating product in the European Coatings Show (ECS). The launch aims to establish a key presence in the polyurethane business segment.
- October 2022- BASF SE launched a new polyurethane product. The company announced the launch of the RODIM film made from PU to protect the paint of a car. The film is invisible and is expected to provide multifaceted, long-lasting protection for automotive coating.
- September 2021- Mitsui Chemicals and SKC Polyurethanes Inc. announced to dissolve polyurethane raw material business joint venture agreement between them. After this, both the companies can use their own strategic policies to grow their business.
- June 2021 – BASF and Shanghai Harvest Insulation Engineering Co., Ltd prepared a Joint Development Agreement (JDA) to innovate prefabricated cryogenic pipes with the use of Elastopor Cryo, a polyurethane rigid foam system of BASF. In this agreement, BASF will develop and test, and Harvest will design and produce the prefabricated pipes.
- September 2020 –WEG developed polyurethane W-THANE APA 501 anti-viral coatings for medical applications. This product was strategically launched amid the COVID-19 outbreak to improve the hygiene & safety of industries that WEG serves. These coatings were launched in diversified colors and claimed to inactivate 99.9% of coronavirus within minutes of contact.
REPORT COVERAGE
An Infographic Representation of Polyurethane (PU) Market
 Market")
 View Full Infographic
To get information on various segments, share your queries with us
The report provides a detailed analysis of the market and focuses on crucial aspects such as leading companies, products, and applications. Also, the report offers insights into the market trends and highlights vital industry developments. In addition to the factors mentioned above, the report encompasses various factors that have contributed to the growth of the market in recent years.
Report Scope & Segmentation
|
ATTRIBUTE |
DETAILS |
|
Study Period |
2021-2034 |
|
Base Year |
2025 |
|
Estimated Year |
2026 |
|
Forecast Period |
2026-2034 |
|
Historical Period |
2021-2024 |
|
Growth Rate |
CAGR of 4.4% from 2026 to 2034 |
|
Unit |
Value (USD Billion); Volume (Kiloton) |
|
Segmentation |
By Product Type
|
|
By Application
|
|
|
By Geography
|
Frequently Asked Questions
Fortune Business Insights says that the global market size was USD 96.11 billion in 2025 and is expected to reach USD 148.37 billion by 2034.
In 2025, the market size stood at USD 96.11 billion.
Growing at a CAGR of 4.4%, the market will exhibit steady growth over the forecast period (2026-2034).
The furniture segment is expected to lead the market during the forecast period.
The rising demand from the furniture industry and increasing footwear production are the factors driving the market growth.
China held the largest share of the market in 2025.
BASF, Covestro AG, and Huntsman are the key players in the market.
The rising demand for foams from the furniture industry is expected to drive the adoption of these products.


- 2021-2034
- 2025
- 2021-2024
- 320
Get 30-60 hrs Free Customization
Expand Regional and Country Coverage, Segments Analysis, Company Profiles, Competitive Benchmarking, and End-user Insights.
Related Reports
-
US +1 833 909 2966 ( Toll Free )
-
Get In Touch With Us