Water and Wastewater Treatment Market Size, Share & Industry Analysis, By Segment (Chemicals {pH Conditioners, Coagulants & Flocculants, Disinfectants & Biocidal Products, Scale & Corrosion Inhibitors, Antifoam Chemicals, and Other Chemicals}, Equipment {Biological, Filtration, Sludge Treatment, Disinfection, and Other Equipment}, and Services {Designing & Installation, Operations, Maintenance, Others}), By Application (Municipal and Industrial {Food & Beverage, Power Generation, Pharmaceuticals, Pulp and Paper, Oil & Gas, Petrochemical, and Others}), and Regional Forecast, 2026-2034
KEY MARKET INSIGHTS
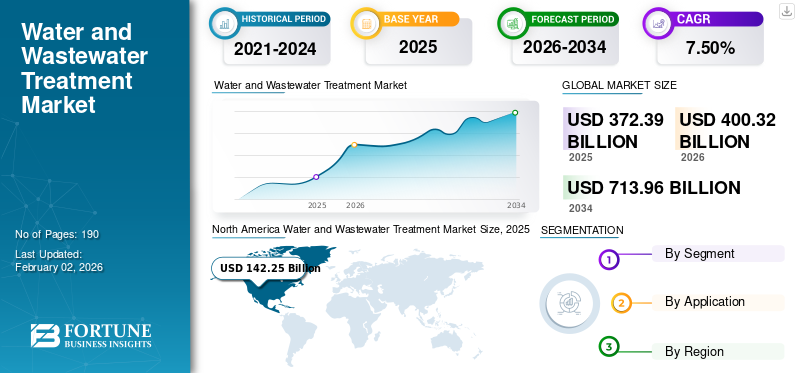
The global water and wastewater treatment market size was valued at USD 372.39 billion in 2025 and is projected to grow from USD 400.32 billion in 2026 to USD 713.96 billion by 2034, exhibiting a CAGR of 7.50% during the forecast period. North America dominated the water and wastewater treatment market with a market share of 38.20% in 2025. Moreover, the water and wastewater treatment market size in the U.S. is projected to grow significantly, reaching an estimated value of USD 314.96 billion by 2032, driven by the rising focus on water reuse, membrane technologies, and smart water management systems.
Water and wastewater treatment is necessary to meet the growing demand for clean water resources, serving municipal, agricultural, and critical industrial processes. Currently, over 40% of the global population resides in regions experiencing acute water stress. With only about 1% of the Earth’s water being freshwater, countries grappling with severe water scarcity are compelled to carry out treatment to convert seawater into freshwater via the desalination process.
The COVID-19 pandemic had a significant impact on the global economy. According to a Global Water Leaders Group survey, industrial water demand was estimated to decline by about 27% during the FY 2019-2020. Moreover, several countries announced emergency measures to prevent the spread of the virus, which affected the revenue of municipal water treatment authorities. For instance, a water utility in Brazil agreed with the government’s call to defer water bills and announced three months of tariff exemptions for low-income households. It also announced donations of water tanks in one of the largest settlements in its service area.
Download Free sample to learn more about this report.
Global Water and Wastewater Treatment Market Key Takeaways
Market Size & Forecast:
- 2025 Market Size: USD 372.39 billion
- 2026 Market Size: USD 400.32 billion
- 2034 Forecast Market Size: USD 713.96 billion
- CAGR: 7.5% from 2026–2034
Market Share:
- North America dominated the water and wastewater treatment market with a 38.20% share in 2025, driven by increasing adoption of smart water management systems, membrane filtration technologies, and a strong focus on water reuse.
- By segment, the services segment held the largest share in 2026, supported by growing investment in upgrading and maintaining new and existing water treatment facilities, especially in developed economies.
Key Country Highlights:
- United States: Projected to reach USD 314.96 billion by 2032, growth is driven by strong demand from the beverage, pharmaceutical, and power sectors and increased investment in advanced treatment infrastructure.
- China: Rising population, water pollution concerns, and large-scale urbanization have fueled massive investments in wastewater infrastructure and advanced treatment technologies.
- India: Rapid urban growth, industrial expansion, and water scarcity issues have prompted strong government initiatives to develop and modernize municipal and industrial wastewater systems.
- Europe: Growth is supported by stringent water quality regulations under the EU Water Framework Directive and innovation in treatment technologies across Germany, France, and the U.K.
- Brazil: Municipal initiatives such as water bill exemptions and community water tank donations during the COVID-19 pandemic have influenced market dynamics, highlighting the role of equitable access.
Water and Wastewater Treatment Market Trends
Smart Management of Wastewater Treatment Plants
With industrial modernization, the demand for advanced and smart technologies is also increasing. The implementation of smart water and wastewater treatment technologies complies with strict regulations, ensuring higher quality services along with strict control on operating costs.
Through R&D, manufacturers develop and employ various new technologies. For instance, Veolia Water Technologies designed CISPEO, which offers an extensive range of solutions dedicated to the smart management of wastewater treatment plants. These smart solutions are very helpful in monitoring the operating processes and rectifying the failures as well. Advanced treatment plants are producing higher quality sludge, which is further effectively used to produce energy or can be used as recycled products in the agricultural industry.
Such activities are creating healthy competition in terms of introducing and adopting smart wastewater treatment technologies and consecutively boosting water and wastewater treatment market growth.
Download Free sample to learn more about this report.
Water and Wastewater Treatment Market Growth Factors
Stringent Regulations on Effluent Treatment to Drive Market Growth
Governments worldwide are enacting stringent regulations to address water pollution and ensure sustainable water management practices. Regulatory bodies such as the Environmental Protection Agency (EPA) in the U.S., the European Union Water Framework Directive, and similar agencies globally impose strict effluent discharge limits on industries and municipalities. These regulations mandate the implementation of advanced treatment technologies to meet specified water quality standards, driving the adoption of water and wastewater treatment solutions.
Moreover, rapid urbanization and population growth exert pressure on existing water resources and wastewater infrastructure. Urban areas generate significant volumes of wastewater from domestic activities, stressing municipal treatment facilities. Moreover, inadequate sanitation in developing regions exacerbates water pollution issues, necessitating investments in wastewater treatment infrastructure. Governments and municipalities are increasingly investing in expanding and upgrading wastewater treatment plants to accommodate growing populations and address water quality concerns.
RESTRAINING FACTORS
High Cost of Wastewater Treatment to Impede Market Growth
One of the primary barriers to wastewater treatment adoption is the high initial capital investment required for setting up treatment plants and infrastructure. Advanced treatment technologies such as membrane filtration, reverse osmosis, and ultraviolet disinfection systems involve significant upfront costs for equipment procurement, installation, and facility construction. This capital-intensive nature of wastewater treatment projects poses a financial hurdle for industries and municipalities, particularly in regions with limited financial resources.
In addition to capital expenses, wastewater treatment facilities entail ongoing operational and maintenance costs. Energy consumption, chemical usage, labor, and periodic equipment maintenance contribute to the overall operational expenditures of treatment plants. Moreover, the complexity of advanced treatment technologies often requires skilled personnel for operation and monitoring, further adding to operating costs. Balancing the need for efficient treatment with the associated operational expenses presents a challenge for stakeholders in the water and wastewater treatment sector.
Water and Wastewater Treatment Market Segmentation Analysis
By Segment Analysis
Services Segment Dominated the Market Due to Growing Focus on Upgrading New Treatment Plants
Based on segment, the market f is classified into chemicals, equipment, and services.
The servicessegment is expected to lead the market, contributing 66.12% globally in 2025. It includes designing & installation, operations, maintenance and other relevant services. Increasing focus of the companies on the construction of novel treatment plants while maintaining the existing facilities for water and wastewater treatment is driving the market. The segment's growth will be further complemented by the need to upgrade the existing sewage treatment facilities in developed countries.
The chemicals segment is further divided into disinfectants, coagulants & flocculants, pH conditioners, antifoam chemicals, scale & corrosion inhibitors, and others. The coagulants & flocculants segment is dominating the market as they are vital chemicals that cause sedimentation in sludge treatment techniques.
The equipment segment is divided into filtration, biological, demineralization, disinfection, sludge treatment, and others. While the filtration equipment segment holds the largest share in the market, disinfection is expected to be the fastest-growing equipment sub-segment. This is owing to substantial investments planned by governments to reduce the spread of diseases through drinking water.
By Application Analysis
To know how our report can help streamline your business, Speak to Analyst
Municipal Segment Dominates Due to High Water Treatment Demand in Agriculture Sector
Based on application, the market is fragmented into municipal and industrial. The industrial segment is further sub-divided into food & beverages, power generation, pharmaceuticals, pulp and paper, oil & gas, petrochemical, and others.
Agriculture accounts for around 30% of the world’s water demand, contributing to the dominance of the municipal segment. Moreover, using municipal water for amusement activities such as swimming pools and adventure parks is anticipated to increase the demand for advanced water and wastewater treatment solutions.
Significant growth is expected for the industrial segment in the upcoming years, attributed to the tightening of regulations in developing countries. The industrial segment is anticipated to hold a dominant market share of 48.89% in 2026. Technological advances such as bioremediation and ozone treatment, developed by Culligan Industrial Water and Suez Worldwide, will be critical for the segment’s growth during the forecast period.
REGIONAL INSIGHTS
Based on geography, the market for water and wastewater treatment is studied across Europe, North America, Asia Pacific, South America, and the Middle East & Africa.
North America
North America Water and Wastewater Treatment Market Size, 2025 (USD Billion)
To get more information on the regional analysis of this market, Download Free sample
North America contributed 38.20% to the global market in 2025, with a valuation of USD 142.25 billion, and is projected to reach USD 151.9 billion in 2026. This growth is associated with the heavy demand for treated water from the beverages and pharmaceutical industries in the U.S. Moreover, the demand for higher power generation to support the growth of industries in the region has boosted the demand for demineralized water, which has further accelerated market growth. The U.S. market is projected to reach USD 138.93 Billion by 2026.
To know how our report can help streamline your business, Speak to Analyst
Asia Pacific
The Asia Pacific market was valued at USD 140.12 billion in 2025, capturing 37.60% of global revenue, and is estimated to reach USD 152.29 billion in 2026. Asia Pacific is also expected to witness significant growth during the forecast market due to rapid industrialization, urbanization, and population growth. China and India are witnessing substantial investments in wastewater infrastructure to address water pollution concerns. Additionally, increasing government focus on water reuse, desalination projects, and smart water management systems is accelerating the adoption of advanced treatment technologies across the region. The Japan market is projected to reach USD 3.96 Billion by 2026, the China market is projected to reach USD 99.8 Billion by 2026, and the India market is projected to reach USD 23.3 Billion by 2026.
Europe
Europe accounted for USD 60.78 billion in 2025, representing 16.30% of the global market share, and is projected to reach USD 64.67 billion in 2026. Europe’s market growth is associated with stringent environmental regulations and technological advancements in treatment solutions. The region is also emphasizing circular economy practices, energy-efficient treatment processes, and sludge management technologies, further supporting market expansion. The UK market is projected to reach USD 11.09 Billion by 2026, while the Germany market is projected to reach USD 11.77 Billion by 2026.
Latin America and the Middle East & Africa
The market in Latin America and the Middle East & Africa is expected to experience considerable growth during the forecast period due to increasing regulatory pressure and infrastructure development initiatives. Rising water scarcity, expanding municipal treatment facilities, and growing investments in desalination and industrial wastewater treatment are key factors driving market demand in these regions. The market in Middle East & Africa reached USD 16.51 billion in 2025, representing 4.40% of total market revenue, and is projected to reach USD 17.18 billion in 2026.
South America
In 2025, the South America market stood at USD 12.73 billion, representing 3.40% of global demand, and is projected to grow to USD 13.66 billion in 2026.
List of Key Companies in Water and Wastewater Treatment Market
Leading Companies to Focus on Sustainable Organic Growth to Fortify their Market Prospects
The competitive landscape of the global market for water and wastewater treatment is highly fragmented and is slowly consolidating, with key companies, such as Veolia and Suez Environment, building a diverse portfolio to capture a significant share of this market and build operational efficiency. On the other hand, the focus of the domestic players is to develop strategic partnerships with industries to provide them with water and wastewater treatment services and maintenance solutions.
List of Key Companies Profiled:
- Veolia (France)
- SUEZ Worldwide (France)
- DuPont (U.S.)
- 3M (U.S.)
- Xylem (U.S.)
- Kemira (Finland)
- Evoqua Water Technologies LLC (U.S.)
- Pentair PLC (U.K.)
- Ecolab (U.S.)
- American Water (U.S.)
- Acciona (Spain)
- Hydro International (U.K.)
- Aquatech International LLC (U.S.)
- Trojan Technologies (Canada)
- BioMicrobics Inc. (U.S.)
- Kurita Water Industries Ltd. (Japan)
- ASIO (Czech Republic)
KEY INDUSTRY DEVELOPMENTS:
- March 2023 – Aquatech International partnered with Fluid Technology Solutions, Inc., a cutting-edge producer of sophisticated membranes and separation technologies. Together, they aim to develop next-generation solutions for enhanced brine concentration, advanced separation, and water reuse.
- January 2023 – Xylem Inc. agreed to acquire Evoqua in an all-stock deal with an indicated enterprise value of roughly USD 7.5 billion. The merged business will be uniquely positioned to create and deliver a more comprehensive range of cutting-edge solutions by building on Xylem’s global leading position in water solutions and Evoqua’s specialty in offering advanced treatment systems and services.
- April 2022 – To assist the creation of cutting-edge water and industrial innovations, Xylem announced investments in venture capital funds Burnt Island Ventures and The Wastly Group’s Funds. These investments aimed to strengthen Xylem Innovation Labs’ open innovation network and its dedication to quickly and widely commercialize the most significant advancements in water technology.
- January 2022 – Evoqua Water Technologies LLC announced that it had acquired Renal Business, which Mar Cor Purification and Cantel Medical operated, subsidiaries of STERIS Group. The acquisition strengthened the company’s position in North America to offer high-quality water solutions for the healthcare industry.
- November 2021 – Kemira expanded its production capacity of water treatment chemicals in the U.K. With this expansion, the manufacturing volume of ferric-based water treatment chemicals in Goole would increase by more than 100 kilotons annually. In January 2021, the company increased the production of aluminium-based water treatment chemicals in Ellesmere Port by 30,000 tons.
REPORT COVERAGE
The market report provides a detailed analysis of the market and focuses on key aspects, such as leading companies, technologies, and leading application areas. Besides this, it offers insights into the latest market trends and highlights key industry developments. In addition to the aforementioned factors, the sample report encompasses several factors that have contributed to the growth of the market in recent years.
Request for Customization to gain extensive market insights.
Report Scope & Segmentation
|
ATTRIBUTE |
DETAILS |
|
Study Period |
2021-2034 |
|
Base Year |
2025 |
|
Estimated Year |
2026 |
|
Forecast Period |
2026-2034 |
|
Historical Period |
2021-2024 |
|
Growth Rate |
CAGR of 7.50% from 2026-2034 |
|
Unit |
Value (USD Billion) |
|
Segmentation
|
By Segment
|
|
By Application
|
|
|
By Geography
|
Frequently Asked Questions
Fortune Business Insights says that the global market size was USD 372.39 billion in 2025 and is projected to reach USD 713.96 billion by 2034.
North America held the largest market share and is expected to dominate the market during the forecast period, with the regional market valued at USD 142.25 billion in 2025.
In 2025, the market value of North America stood at USD 142.25 billion.
Growing at a CAGR of 7.50%, the market will exhibit steady growth in the forecast period (2026-2034).
Stringent regulations regarding industrial effluent treatment is a key factor fueling the demand for these solutions.
Veolia, Suez, and Xylem are the top players in the market.
North America dominated the water and wastewater treatment market with a market share of 38.20% in 2025


- 2021-2034
- 2025
- 2021-2024
- 190
Get 30-60 hrs Free Customization
Expand Regional and Country Coverage, Segments Analysis, Company Profiles, Competitive Benchmarking, and End-user Insights.
Related Reports
-
US +1 833 909 2966 ( Toll Free )
-
Get In Touch With Us