Activated Carbon Market Size, Share & Industry Analysis, By Type (Powdered, Granular, and Others), By Application (Water Treatment, Air & Gas Purification, Food & Beverage, Pharmaceutical & Healthcare Treatment, and Others), and Regional Forecast, 2026-2034
KEY MARKET INSIGHTS
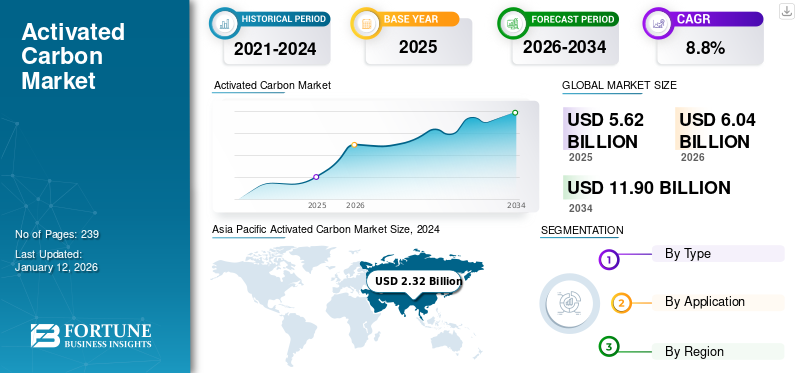
The global activated carbon market size was valued at USD 5.62 billion in 2025 and is projected to grow from USD 6.04 billion in 2026 to USD 11.9 billion in 2034, exhibiting a CAGR of 8.8% during the forecast period. Asia Pacific dominated the activated carbon market with a market share of 43.95% in 2025. Moreover, the U.S. activated carbon market is projected to reach USD 2.00 billion by 2032, fueled by water purification, air filtration, and industrial applications.
Activated carbon, also known as activated charcoal, is renowned for its exceptional adsorption properties. It plays a pivotal role in several applications, such as air treatment, water purification, and industrial processes. The market has experienced significant growth owing to increasing environmental concerns and stringent regulations. Growing environmental concerns and awareness have led to strict emissions guidelines. This, in turn, has encouraged several manufacturers to invest in developed technologies and advanced concepts for the use of the product in several applications. It is increasingly used for water treatment, such as drinking water, service water, groundwater, and wastewater.
Moreover, innovations in production processes have also led to the development of activated carbon with tailored pore structures, as a result, enhancing adsorption capacities for specific pollutants. These advancements have surged its use across various application such as cleaning and air treatment. The major companies operating in the market include Osaka Gas Chemicals Co., Ltd., Donau Carbon GmbH, Cabot Corporation, PURAGEN ACTIVATED CARBONS, and CARBOTECH AC GMBH.
Download Free sample to learn more about this report.
Global Activated Carbon Market Overview
Market Size & Forecast:
- 2025 Market Size: USD 5.62 billion
- 2026 Market Size: USD 6.04 billion
- 2034 Forecast Market Size: USD 11.9 billion
- CAGR: 8.8% from 2026–2034
Market Share:
- Asia Pacific dominated the activated carbon market with a 40.7% share in 2024, driven by strict environmental policies, rapid industrialization, and demand for water and air purification across China, India, and Southeast Asia.
- By type, granular activated carbon (GAC) is expected to retain the largest market share in 2025, supported by its reusability, efficient contaminant removal, and growing applications in water treatment, food & beverage, and industrial air purification.
Key Country Highlights:
- United States: Projected to reach USD 2.00 billion by 2032, the U.S. market is fueled by demand in water purification, air filtration, and industrial applications, along with stringent environmental regulations.
- China: Leads both production and consumption, supported by abundant raw material availability, low costs, and high product use in industrial wastewater treatment and air purification.
- Germany: Environmental sustainability and automotive emission control drive demand for high-performance activated carbon in air filtration and water purification applications.
- Mexico: Growth in pharmaceutical and water purification industries is driving activated carbon consumption, supported by regional industrial expansion.
MARKET TRENDS
ACTIVATED CARBON MARKET TRENDS
Increasing Focus of Key Players On Reactivated Carbon is Prominent Trend in Market
The rise in product consumption has drastically increased over the past few years. This has increased the demand to recycle or reactivate the product due to the limited presence of raw materials. The activated carbon can be returned to its primary activation stage by the thermal process in which organic and inorganic contaminants are removed, enhancing the adsorption capacity. This reactivated carbon reduces the polluting manufacturing waste and the amount of toxic gases such as CO2 and carbon monoxide. Additionally, the re-activation of the carbon prevents the landfills from being taken up by the granular activated carbon. Therefore, the benefits of re-activation have increased the space for the product manufacturer to recycle the product. Therefore, the consumption of this type of carbon has gradually increased over time.
MARKET DYNAMICS
MARKET DRIVERS
Increased Product Demand in Air Purification Systems to Boost Market Growth
The rising air pollution across the globe has surged the demand for air purification systems in factories and generators. Nowadays, growing concerns over air quality lead to a surge in the high demand for activated carbon in air purification systems to remove volatile organic compounds (VOCs) and other airborne contaminants.
Furthermore, the rise in industrialization and the increasing number of coal-based electricity-generating power plants have increased air pollution. As a result, different countries' governments have issued new policies to control the emission of pollution. Therefore, product consumption for end products, such as carbon filters, has increased. These filters extract the micro impurities from the air when they pass through it owing to their bed structure made of powdered or granular carbon. Additionally, such carbon filters deliver remarkable filtration against chemicals and hazardous gases, such as SOX and NOX. Hence, such factors increase the product demand from the end-use industries such as air & gas purification for improving indoor and outdoor air quality.
Increasing Demand for Activated Charcoal for Personal Care Application to Fuel Market Growth
The market is growing rapidly due to the rising adoption of activated charcoal in the personal care industry. The increasing skin consciousness amongst consumers, advancement in personal care products, and growing consumer disposable income are significant factors anticipated to boost the personal care industry globally. This leads to the consumption of activated charcoal in the personal care industry. The ability of the product to eliminate bacteria, poison, dirt, and chemicals from the skin's surface helps to reduce acne, making it a preferred choice in personal care products.
Additionally, activated charcoal has excellent purifying abilities, which makes it a popular ingredient in the beauty industry. Its major consumption can be seen in hair care products to soothe itchy, face masks to draw out unwanted gunk, and toothpaste to brighten teeth and flaky scalps. Hence, the rapid increase in the personal care industry, growing consumer preference to purchase activated charcoal-based products, along with the increasing awareness of the benefits of activated charcoal amongst the people are anticipated to drive activated carbon market growth.
MARKET RESTRAINTS
Hike in Prices Due to Raw Material Shortage and High Production Cost to Impede Market Growth
The scarcity of various raw materials, such as coconut shell charcoal, used for production is a risk factor in the market growth. Shortage of these raw materials makes the supply chain vulnerable to disruptions due to geopolitical tensions, environmental events, or regulatory changes, leading to potential shortages and price volatility. As a result, the prices of the raw materials have risen mainly from coconut shell charcoal. Furthermore, coal-based product prices have increased due to higher energy needs. Coal is widely used in key application areas such as electricity, cement, and iron & steel plants in China. This has resulted in a shortage of coal grades that are used to manufacture the product. Moreover, the manufacturing of high-quality activated carbon involves substantially higher costs, which, therefore, can be a barrier for several applications, especially in cost-sensitive industries. Hence, such factors act as a restrain for the market.
TRADE PROTECTIONISM
Trade protectionism, such as tariffs or quotas, can impact the activated carbon market, potentially leading to higher prices for consumers and hindering international trade while also potentially impacting the environment and carbon emissions. Also, the introduction of environmental regulations, such as the European Union's Carbon Border Adjustment Mechanism (CBAM), aims to impose levies on high-carbon imports, including steel and aluminum. While not directly targeting activated carbon, such policies reflect a broader trend toward trade measures that could influence global supply chains and production costs in related sectors.
Download Free sample to learn more about this report.
IMPACT OF COVID-19
The recent COVID-19 pandemic resulted in a decrease in global productivity and affected several economies across the world. The stagnant nature of manufacturing units has led to a reduction in the production rate. This has led to reduced availability of activated charcoal globally. The temporary shutdown of production facilities in various industries has reduced the usage of the product in industrial wastewater treatment and air filtration. However, the increasing awareness toward water treatment and air purification from consumers and the normalization of industrial activities in 2021 has supported the market recovery from the COVID-19 impact.
SEGMENTATION ANALYSIS
By Type
Granular Type to Exhibit Fastest-growth Owing to Increasing Preference from End-Use Industries
On the basis of type, the global market is segmented into powdered, granular, and others.
Among these, the granular segment holds the highest share of the market. This is mainly due to the high product demand from air treatment and water purification systems, owing to its reusability and effective contaminant removal properties. GAC has a comparatively larger particle size than powdered form, thereby making it suitable for removing contaminants from liquids, air, and gases. GAC is used in the food & beverage industry to remove impurities, odor, and color from sweeteners, syrups, beverages, amino acids, and organic acids. It is also used in wastewater treatment to remove oil, industrial pollutants, heavy metals, and pesticides. Additionally, the growing demand for granular form can be attributable to its easy regeneration and reusability, which leads to overall market growth.
PAC segment is anticipated to grow significantly owing to its rising demand from water treatment applications due to its high adsorption efficiency. The segment dominated the market share of 46% in 2024. This type has a particle size smaller than 0.177mm, as defined by ASTM. Thus, it has a larger surface-area-to-volume ratio. PAC is used to remove a wide range of organic contaminants that impart color, odor, and taste from wastewater, potable water, and water required in industrial processes. It is also used in processes with high flow rates of liquids to minimize capital expenditure. Hence, the major application of PAC is for water treatment.
To know how our report can help streamline your business, Speak to Analyst
By Application
Water Treatment Segment to Dominate Owing to Increasing Industrial Activities
Based on application, the market is categorized into water treatment, air & gas purification, food & beverage, pharmaceutical & healthcare treatment, and others.
The water treatment segment held the largest activated carbon market share in 2024 and is expected to remain the largest throughout the forecast period. This demand is attributed to a rising necessity for clean & safe drinking water worldwide and stringent environmental regulations. The product is commonly used in water treatment to adsorb organic compounds, odor, and taste compounds, toxic substances, and oils. It is widely used due to its high porosity and offers a larger surface area for adsorption. The segment is expected to dominate the market share of 40.23% in 2026.
The air & gas purification segment holds a significant share of the global market. The rising application owing to growing concerns about air quality and the need to remove airborne contaminants is surging product adoption in this segment. Moreover, stringent regulations by the government to mitigate the impact of flue gas emissions on the environment have propelled industries to incorporate air purification & filtration technologies. Furthermore, the growing use of activated carbon for mercury control technology is supporting the market growth.
The food & beverage segment is growing at a significant rate due to the increasing product preference for minimizing food and beverage contamination. In the food & beverage industry, the product is used to remove contaminants, such as odor and color-imparting substances, heavy metals, toxic components, amino acids, and refining edible oil. Consumers' increasing attention toward food safety and quality is expected to support market growth. Furthermore, the product has applications in industries to recover various solvents and purification of CO2 and waste gases, and control mercury vapor emissions, especially from fossil fuel-based power plants. This segment is anticipated to forecast a CAGR of 8.04% during the forecast period.
The pharmaceutical & healthcare treatment segment is emerging as a growing application area, with significant usage in hemodialysis treatments and pharmaceutical processing. In this segment, the applications of activated charcoal involve the treatment of overdoses, poisoning, indigestion, and flatulence.
Charcoal is used in other applications such as rare metal recovery, energy storage, and specialty chemicals manufacturing. The current rising demand for energy has led to growth in the manufacturing of energy storage devices, thereby increasing the product consumption in batteries.
ACTIVATED CARBON MARKET REGIONAL OUTLOOK
Based on region, the market is segmented into North America, Europe, Asia Pacific, Latin America, and the Middle East & Africa.
Asia Pacific
Asia Pacific Activated Carbon Market Size, 2025 (USD Billion)
To get more information on the regional analysis of this market, Download Free sample
In 2025, Asia Pacific generated USD 2.47 billion, contributing 44.10% to global market revenue, and is projected to grow to USD 2.69 billion in 2026. The major attributable factors include strict environmental policies along with rapid industrialization, thereby surging the high demand for activated charcoal in sectors such as air purification and water treatment. Additionally, the ease of availability of raw materials and their low costs are expected to support the market's growth. The market value in China is expected to be USD 1.62 billion in 2026.
On the other hand, Japan is projecting to hit USD 0.31 billion and India is likely to hold USD 0.32 billion in 2026.
To know how our report can help streamline your business, Speak to Analyst
North America
The North America region captured 22.20% of the global market in 2025, generating USD 1.25 billion in revenue, and is projected to reach USD 1.33 billion in 2026. North America's market growth is associated with stringent environmental regulations and a robust industrial base, particularly in the U.S. and Canada. The regulations imposed by the government on the disposal of industrial wastewater and gas emissions have led to the growth in the use of the product for removing contaminants such as CO2, mercury vapors, and other toxic gases. U.S. accounted for the larger market share in 2024 and is expected to continue its dominance throughout the forecast period. This dominance is associated with the expansion of the healthcare & pharmaceutical industry in the country. The product demand is mainly rising in the manufacturing of medicines, including paracetamol, from natural and synthetic raw materials. The U.S. market size is estimated to be USD 1.21 billion in 2026.
Europe
Europe is anticipated to account for the second-highest market size of USD 1.72 billion in 2026, exhibiting the second-fastest growing CAGR of 8.06% during the forecast period. In Europe, Germany, France, and U.K. have established markets due to stringent regulations on environmental sustainability and water quality. As a result, fostering the demand for high-quality activated carbon solutions. In addition, regulations have also influenced automotive manufacturers to use activated charcoal to minimize emissions from the vehicle. This is expected to create several growth opportunities for the market in Europe. The market value in U.K. is expected to be USD 0.32 billion in 2026.
On the other hand, Germany is projecting to hit USD 0.43 billion in 2026, and France is likely to hold USD 0.335 billion in 2025.
Latin America
The Latin America market generated USD 0.13 billion in 2025, representing 2.30% of the global market landscape, and is expected to reach USD 0.14 billion in 2026. The market in Latin America is expected to observe significant growth in the coming years. Mexico is the major country in this region. Increasing product consumption in the water purification and pharmaceutical industries for deodorization and decolonization is projected to drive the market.
Middle East & Africa
Middle East & Africa recorded a market size of USD 0.15 billion in 2025, capturing 2.80% of the global market share, and is projected to reach USD 0.17 billion in 2026. In the Middle East & Africa, low water availability, increasing oil exploration, and industrial activities are the key factors influencing the demand for purification applications that are driving the activated charcoal market growth. Saudi Arabia region is anticipated to hit USD 0.61 billion in 2025.
COMPETITIVE LANDSCAPE
KEY INDUSTRY PLAYERS
Key Market Players to Strengthen Their Position by Providing Sustainability Solutions to Various Industries
Major producers, such as Kuraray Co., Ltd., Cabot Corporation, and other players, such as Calgon Carbon Corporation and Jacobi Carbons, have a widespread presence globally. They offer various types of activated charcoal products. Kuraray Co., Ltd. and Cabot Corporation used acquisition and new product developments as their key strategies to increase their global presence and serve the customer demand in the market. These companies serve various end-use industries such as water treatment, pharmaceutical, oil & gas, and food & beverage.
Osaka Gas Chemicals Co., Ltd. develops and uses technologies to supply various products to meet consumer requirements. These include products with higher performance for special industrial applications, such as air environment, water purification, food, and beverages.
LIST OF KEY ACTIVATED CARBON COMPANIES PROFILED
- Osaka Gas Chemicals Co., Ltd. (Japan)
- Donau Carbon GmbH (Germany)
- Cabot Corporation (U.S.)
- PURAGEN ACTIVATED CARBONS (U.S.)
- CARBOTECH AC GMBH (Germany)
- Kuraray Co., Ltd. (Japan)
- KUREHA CORPORATION (Japan)
- Activated Carbon Technologies (Australia)
- Silcarbon Aktivkohle GmbH (Germany)
- Ingevity (U.S.)
- Iluka Resources (Australia)
- James Cumming & Sons (Australia)
- Universal Carbons (India)
- Carbon Activated Corporation (U.S.)
- Tronox (U.S.)
- Active Char Products (India)
- Genuine Shell Carb (India)
KEY INDUSTRY DEVELOPMENTS
- May 2024 – Kuraray Co., Ltd. along with its U.S. subsidiary Calgon Carbon Corporation is set to acquire Sprint Environmental Services, LLC’s industrial reactivated carbon business.
- March 2023 – Cabot Corporation launched the EVOLVE technology program that is involved in advancing sustainable reinforcing carbons. The purpose of the new technology launch was to recover the carbon product from the end-life tiers to renew the waste and reduce the carbon content.
- January 2023 – Cabot Corporation announced that it would invest USD 200 million in the U.S. to add conductive carbons capacity at their existing Pampa, Texas, U.S. facility. The purpose of the investment is aimed at product expansion in the country for the next five years.
- October 2022- Kuraray Co., Ltd announced that it would finish the running test operation of the reactivated carbon production facility on its Feluy plant in Germany.
- August 2022- Ingevity announced an investment of USD 60 million in lithium-ion anode materials to secure a future activated carbon supply relationship with Nexeon. This investment aims to maximize the revenue from the activated carbon product segment.
REPORT COVERAGE
The market report provides a detailed analysis of the market and focuses on crucial aspects such as leading companies, applications, and types. Also, it offers insights into market trends and highlights vital industry developments. In addition to the factors mentioned above, it encompasses various factors that have contributed to the growth of the market in recent years.
Request for Customization to gain extensive market insights.
Report Scope & Segmentation
|
ATTRIBUTE |
DETAILS |
|
Study Period |
2021-2034 |
|
Base Year |
2025 |
|
Estimated Year |
2026 |
|
Forecast Period |
2026-2034 |
|
Historical Period |
2021-2024 |
|
Growth Rate |
CAGR of 8.8% from 2026-2034 |
|
Unit |
Value (USD Billion) and Volume (Kiloton) |
|
Segmentation |
By Type
|
|
By Application
|
|
|
By Region
|
Frequently Asked Questions
Fortune Business Insights says that the global market size was USD 6.04 billion in 2026 and is projected to record a valuation of USD 11.9 billion by 2034.
In 2025, the Asia Pacific market size stood at USD 2.47 billion.
Growing at a CAGR of 8.8%, the market will exhibit rapid growth during the forecast period.
Water treatment is expected to be the leading segment in the market under the application segment during the forecast period.
Increasing demand for water treatment applications is expected to drive market growth.
Cabot Corporation, Kuraray Co., Ltd., Donau Carbon GmbH, and KUREHA CORPORATION are a few of the leading players in the global market.
Asia Pacific dominated the global market in 2025
Rising demand for packaged beverages and an increasing need for clean water are expected to drive the adoption of the product.


- 2021-2034
- 2025
- 2021-2024
- 239
Get 30-60 hrs Free Customization
Expand Regional and Country Coverage, Segments Analysis, Company Profiles, Competitive Benchmarking, and End-user Insights.
Related Reports
-
US +1 833 909 2966 ( Toll Free )
-
Get In Touch With Us