Distributed Energy Resource Management System Market Size, Share & COVID-19 Impact Analysis, By Software (Virtual Power Plant, Management & Control, Analytics), By Application (Solar, Energy Storage, Wind, EV Charging Stations, Others), By End-user (Residential, Commercial, Industrial & Utilities), and Regional Forecasts, 2026-2034
Distributed Energy Resource Management System Market Size
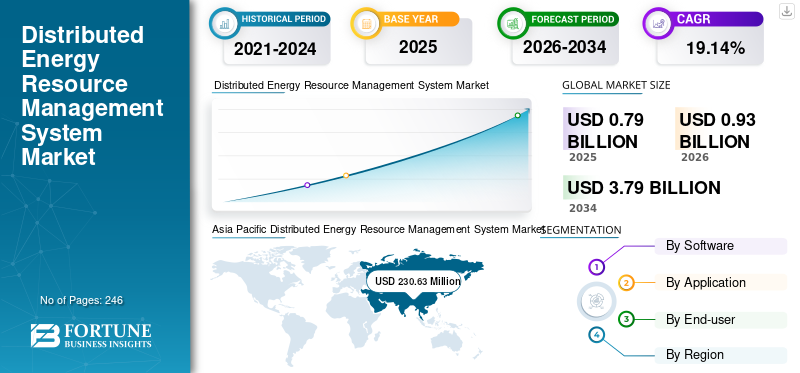
The global distributed energy resource management system market size was valued at USD 0.79 billion in 2025 and is projected to grow from USD o.93 billion in 2026 to USD 3.79 billion by 2034, exhibiting a CAGR of 19.14% during the forecast period. Asia Pacific dominated the global market with a share of 34.72% in 2026. The U.S. market is projected to grow significantly, reaching an estimated value of USD 441.69 million by 2032.
Distributed Energy Resource Management Systems or DERMS are software solutions that control and coordinate various Distributed Energy Resources (DERs). These DERs are of different energy types such as solar, wind, and battery storage. Distributed energy resource management includes the maintenance, control, analysis, demand control, and remote management of energy resources using software and networks.
Download Free sample to learn more about this report.
Distributed Energy Resource Management System (DERMS) Market Overview
Market Size:
- 2025 Value: USD 0.79 billion
- 2026 Value: USD 0.93 billion
- 2034 Forecast Value: USD 3.79 billion
- CAGR: 19.14% (2026–2034)
Market Share:
- Regional Leader: Asia Pacific holds 34.72% market share in 2025, driven by rapid adoption of solar, wind, and storage systems.
- Fastest-Growing Region: Asia Pacific is projected to maintain the highest growth rate during the forecast period.
- End-User Leader: The Industrial & Utilities segment leads the market due to large-scale DER installations and grid management needs.
Industry Trends:
- Virtual Power Plants (VPP) dominate the software segment, offering efficient aggregation of distributed assets like solar, wind, and storage.
- Solar applications account for the largest share, fueled by expanding rooftop solar installations and optimization needs.
- Demand Response software adoption is rising to support utilities in real-time grid balancing and economic dispatch.
Driving Factors:
- Accelerated adoption of clean energy resources such as solar, wind, storage, and EV charging.
- Government initiatives and smart grid policies promoting DERMS deployment for energy efficiency and emissions reduction.
- Rising electricity demand across emerging economies, requiring advanced grid management solutions.
- Integration of ICT, IoT, and real-time analytics into DERMS enhances operational efficiency and system intelligence.
- Growing need for grid flexibility, scalability, and reliability to manage increasing volumes of distributed energy resources.
The remarkable development of industrialization and urbanization worldwide has resulted in energy demand. The growing demand for energy to support the world's livelihood has led to increasing investments in renewable energy resources. Developing the renewable energy sector and managing distributed generation have surged the demand for the distributed energy resource management system.
COVID-19 IMPACT
Decline in Demand for Distributed Energy Resource Management Systems Amid the Pandemic Slowed Down the Market Growth
COVID-19 continues to spread rapidly around the world. The global impact of COVID-19 on the distributed energy resource management system market growth is moderate, as it hampered the growth rate of the DERMS market. Factors such as reduced capital investments in solar and others, radical change in the energy demand patterns due to shutdowns of industries, businesses, and schools, and necessitating the home office mode during the COVID-19 crisis have impacted the market of distributed energy resource management system.
Furthermore, lockdown measures deteriorated power demand due lack of industrial activities, reducing efforts to set up new DERs. However, the rising reliance on renewable energy drives the market growth.
Distributed Energy Resource Management System Market Trends
Increasing Demand Response Management Software to Provide Growth Opportunities
With a rapidly expanding population and an expansion in production activity across many industries, there is a huge demand for products. This is due to the rapidly evolving industrial landscape and rapid urbanization. Massive consumption and growing digitization have also accelerated industry and increased demand for materials, manufacturing capacity, and production. To fulfill power demands, the industrial landscape around the world occasionally experiences significant peak load circumstances. There is a sizable need for demand response management software and systems, which is anticipated to drive the market due to increasing development of intelligent infrastructures and higher power consumption.
According to the International Energy Agency (IEA), quick progress is required in demand-response management, which will require 500 GW of response capacity by 2030 as a result of the continuous expansion of renewable energy projects to meet net-zero emissions goals. The agency went on to add that both the supply and demand sides of the system must be flexible. The need for decentralized energy resource management is anticipated to rise significantly over the next 10 years as a result of numerous nations, including Canada, Singapore, the European Union, and China, announcing renewable energy targets and infrastructure development programs for EV charging stations.
Download Free sample to learn more about this report.
Distributed Energy Resource Management System Market Growth Factors
Smart Grid Deployments by Governments to Reduce Carbon Emission to Promote Market Growth
Several governments have directed the installation of smart grids, making them a critical factor in national energy policies. These countries' energy policies focus on improving efficiency and reducing CO2 emissions. Government entities are increasingly investing in the smart grid sector to fast-track the replacement of old grid structures.
One recent development in this context occurred in July 2022, when the U.S. Trade and Development Agency awarded the Régie Autonome de Distribution d'Eau et d'Electricité de Marrakech (RADEEMA), the electricity and water utility of Marrakech to study the transformation of power infrastructure of Marrakech into smart grid and will serve as a model for other Moroccan cities.
Additionally, in November 2021, the U.S. government passed a new Infrastructure Investment and Jobs Act, wherein the country invests heavily in developing smart and distribution grids. The law provides a USD 3 million investment in the Smart Grid Investment Matching Grant Program.
Increased Deployment of EVs to Augment Product Demand
The growing responsibility for protecting the environment through sustainable development has increased the demand for electric vehicles worldwide. Sales of Electric Vehicles (EVs) in 2021 doubled from 2020 to a record nearly 6.6 million, according to the International Energy Agency (IEA). Almost 10% of global automotive sales were EVs in 2021, which stood at 4% of the market share in 2019. The sales of electric cars are likely to grow strongly in 2022, with 2 million units sold in Q1, up 75% from the same period in 2021.
With technology development, the cost of EVs is reducing, further surging their demand. Governments of different nations have endorsed electric vehicles and set appropriate policies to accelerate the transition to zero-emission vehicles. Environmental regulations and fuel consumption standards determine the EV market.
- In October 2022, the Uttar Pradesh Cabinet approved the new UP EV Policy – Uttar Pradesh Electric Vehicle Manufacturing and Mobility Policy 2022. The electric two-wheelers receive 15% discount on the ex-factory costs. The new policy will support 50,000 electric tricycles and provide a 15% subsidy on the ex-factory cost of up to a certain limit.
With the rise of electric vehicles and a further rise of electric vehicle charging stations, the demand for energy management systems is expected to grow and propel the market.
RESTRAINING FACTORS
Cyber Security Risks Associated with IoT to Hinder Market Growth
A distributed energy resource management system uses Information & Communication Technology (ICT), the Internet of Things (IoT), automated control, energy storage, and demand management. The data from the systems is collected for analysis. The data poses a threat of getting hacked by cyber-attacks and data breaches. For example, in February 2021, Npower, a gas and electricity company, permanently withdrew its mobile app after threat actors used it to access their customers’ personal information. The attackers accessed the customer accounts using login data from another website, leaving customers open to fraud.
The heavy investment in data breach prevention and cybersecurity increases the cost of management systems. This financial disadvantage affects the adoption of distributed energy resource management and is expected to hamper market growth.
Distributed Energy Resource Management System Market Segmentation Analysis
By Software Analysis
Virtual Power Plant Software to Dominate Owing to its Aggregation Capacity with Different Energy Sources
Based on software, the market is trifurcated into Virtual Power Plant (VPP), analytics, and management & control.
The virtual Power Plant (VPP) segment is expected to lead the market, contributing 51.61% globally in 2026. The wide range of features of a VPP, together with elements such as using cloud-based real-time operational control to cluster capacities of diverse Distributed Energy Resources (DERs) to boost efficiency and trading power, make it an appealing option for end-users.
The management & control software assists in remotely managing the distributed energy resource to regulate operations, quickly identify faults, and take the appropriate corrective action. To boost productivity and take advantage of visual datasets, analysis tools and software also assist planners in determining various parameters by integrating massive datasets.
By Application Analysis
Solar Application to Dominate Due to Functional Optimization and Growing Solar Installation
Based on application, the market is segmented into solar, energy storage, wind, EV charging stations, and others.
The solar segment will account for 33.33% market share in 2026. Use of DERMS in solar is utilized to control and optimize the functionalities of solar energy generation. The wide perforation rate of DERMS in the solar industry and the massive utilization of rooftop solar lead to the dominance of solar applications in the distributed energy resource management system market share.
Moreover, DERMS is also utilized for controlling wind power generation and for controlling & maintaining the EV charging station. The growing installation of wind farms and development of EV charging infrastructure across major regions resulted in market growth during the forecast period. The others segment accounts for Combined Heat & Power (CHP) applications and demand response management.
By End-user Analysis
To know how our report can help streamline your business, Speak to Analyst
Industries & Utilities to Dominate Due to the Use of Distributed Energy Resource Management Systems in their Operations
Based on end-user, the market is subdivided into commercial, residential, and industrial & utilities.
The industrial & utilities segment is expected to account for 64.52% of the market in 2026. Due to the significant penetration of DERMS, the industrial & utilities segment dominates the DERMS market. In addition, the industrial & utilities segment creates a significant amount of distributed energy, which contributes to the market's supremacy.
Additionally, the use of distributed energy resource management on a smaller scale than in the industrial & utilities segment is referred to as residential and commercial segments. The significant increase in rooftop PV system installations among commercial and residential end-users, including home and business owners who typically use management, control, and analytic software for efficient operation and optimization, is the segment's primary driver.
REGIONAL INSIGHTS
The global market is analyzed across major regions, Europe, Asia Pacific, Latin America, North America, and the Middle East & Africa.
Asia Pacific
Asia Pacific Distributed Energy Resource Management System Market Size, 2024 (USD Million)
To get more information on the regional analysis of this market, Download Free sample
Asia Pacific to Dominate the Market Owing to Growing Solar & Wind Power Installation
Asia Pacific dominates the distributed energy resource management system market share. The massive growth in solar & wind renewable energy installation coupled with excessive energy demand propels the demand for DERMS across the region. One recent development in this context occurred in August 2022, when Horizon Power launched a new DERMS in Western Australia's regional microgrids, which enables rooftop solar, battery and electric vehicle customers to securely join with utility energy resources. The Japan market is projected to reach USD 0.04 billion by 2026, the China market is projected to reach USD 1.61 billion by 2026, and the India market is projected to reach USD 0.04 billion by 2026.
North America
North America contributed 27.80% to the global market in 2025, with a valuation of USD 0.22 Billion, and is projected to reach USD 0.26 Billion in 2026. The North America market is largely driven by the growing sanctioning of various virtual power plants and distributed resource management projects across the region. For example, in November 2022, Swell Energy raised USD 120 million to expand the categorization of virtual power plants. The U.S. market is projected to reach USD 0.22 billion by 2026.
Europe
Europe accounted for USD 0.15 Billion in 2025, representing 18.57% of the global market share, and is projected to reach USD 0.17 Billion in 2026. Europe has significant projects in DERMS-based software across renewable energy and energy storage-based systems, resulting in demand for distributed energy resource management systems. For example, Statkraft's virtual power plant in Germany produces 10,000 MW+ of electricity to cater to the energy demand. The UK market is projected to reach USD 0.02 billion by 2026, and the Germany market is projected to reach USD 0.06 billion by 2026.
Latin America and the Middle East & Africa
In parallel, the significant investment in renewable energy projects in Latin America and the Middle East & Africa will drive the market's growth. In 2025, the Latin America market stood at USD 0.05 Billion, representing 6.51% of global demand, and is projected to grow to USD 0.6 Billion in 2026. The market in Middle East & Africa reached USD 0.99 Billion in 2025, representing 12.40% of total market revenue, and is projected to reach USD 1.15 Billion in 2026.
KEY INDUSTRY PLAYERS
Key Participants are Concentrating on Enhancing their Business Capacities to Deliver Efficient Products
Most players operating in the market are focusing on the development of virtual power plants with the rise in deployment of the renewable energy industry, which increases the need for managing the energy demand more sustainably.
Consequently, other players are present across the industry, catering to different project requirements. These establishments focus more on delivering newer technological developments for distributed energy generation, forming a significant portion of the global competitive landscape. For example, in May 2022, Oracle partnered with POWER Engineers to help the utilities implement & integrate more reliable and innovative grid modernization solutions. As a part of the partnership, Oracle offered a wide range of suitable Advanced Distribution Management System (ADMS) solutions, including Network Management System (NMS), DERMS, and Outage Management System (OMS) solutions.
List of Top Distributed Energy Resource Management System Companies:
- Itron (U.S.)
- Oracle (U.S.)
- Energy Hub (U.S.)
- AutoGrid Systems (U.S.)
- Opus One Solutions (Canada)
- Blue Pillar (U.S.)
- Kitu Systems (U.S.)
- Enel (Italy)
- Open Access Technology International, Ltd. (U.S.)
- Sunverge Energy Inc. (U.S.)
- Hitachi ABB (Switzerland)
- Schneider Electric (France)
- Siemens (Germany)
- General Electric (U.S.)
- Engie (France)
- Generac (U.S.)
- Mitsubishi Electric Corporation (Japan)
- Doosan Heavy Industries & Construction (South Korea)
KEY INDUSTRY DEVELOPMENTS:
- November 2022 - Oracle offered Advanced Distribution Management System for FirstEnergy, an Ohio-based company, to manage the response to power outages across its six-state electric system. Oracle has helped the company implement its Utilities Network Management System (NMS), which helped FirstEnergy to manage & control centers across its 10 electric utilities actively.
- November 2022 - Awesense Wireless Inc. announced its partnership with Kitu Systems Inc. to accelerate the deployment of Distributed Energy Resource Management Systems (DERMS). The partnership focuses on helping electric utility companies deploy the DERMS and help overcome inaccuracy in data models, lack of real-time visibility, and others.
- October 2022 – Generac’s DERMS was selected by Dominion Energy Virginia to control and manage the grid reliability. The platform can manage the planned distribution of energy resources, including smaller, behind-the-meter consumer devices such as home solar panels, smart thermostats, battery storage, electric vehicles, and other capacity resources.
- September 2022 – Itron linked its IoT with Samsung’s smart platform link to enable utility with an improved DERMS. The solution provides participating consumers with real-time consumption data from their meters, behind-the-meter systems and devices within the SmartThings Energy service to provide a comprehensive picture of energy consumption.
- May 2022 - GE Digital and Opus One Solutions came together to help utilities on their DERs journey with a modular DERMS platform. The software is designed to provide information, operations, profitability, and markets in a modular solution. In this way, network operators can connect, view, control, and optimize the DERs from a technical and economic point of view.
REPORT COVERAGE
The research report presents a comprehensive industry assessment by offering valuable insights, facts, industry-related information, and historical data. Several methodologies and approaches are adopted to make meaningful assumptions and views to formulate the report.
Request for Customization to gain extensive market insights.
REPORT SCOPE & SEGMENTATION
|
ATTRIBUTE |
DETAILS |
|
Study Period |
2021-2034 |
|
Base Year |
2025 |
|
Forecast Period |
2026-2034 |
|
Historical Period |
2021-2024 |
|
Growth Rate |
CAGR of 19.14% from 2026 to 2034 |
|
Unit |
Value (USD Billion) |
|
Segmentation |
By Software
By Application
By End-user
By Region
|
Frequently Asked Questions
Fortune Business Insights study shows that the global market was USD 0.79 billion in 2025.
The global market is projected to grow at a CAGR of 19.14% in the forecast period.
The market size of Asia Pacific stood at USD 0.27 billion in 2025.
Based on software type, the virtual power plant segment holds the dominating share in the global market.
The global market size is expected to reach USD 3.79 billion by 2034.
The key market drivers are the adoption of clean energy and the growing smart grid infrastructure.
The top players in the market are General Electric, Oracle, Siemens, Enel, and Blue Pillar.


- 2021-2034
- 2025
- 2021-2024
- 246
Get 30-60 hrs Free Customization
Expand Regional and Country Coverage, Segments Analysis, Company Profiles, Competitive Benchmarking, and End-user Insights.
Related Reports
-
US +1 833 909 2966 ( Toll Free )
-
Get In Touch With Us