Levulinic Acid Market Size, Share & Industry Analysis, By Technology (Acid Hydrolysis, Biofine, and Others), By Application (Biofuels & Fuel Additives, Polymers & Resins, Cosmetics & Personal Care, Pharmaceutical, Agrochemical, and Others), and Regional Forecast, 2026-2034
Levulinic Acid Market Size and Future Outlook
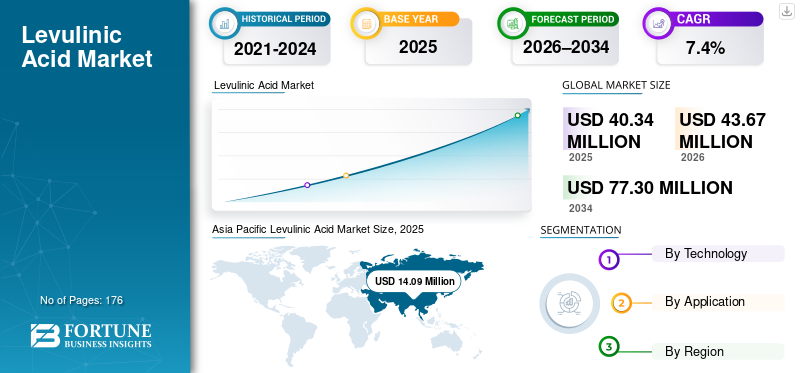
The global levulinic acid market size was valued at USD 40.34 million in 2025. The market is projected to grow from USD 43.67 million in 2026 to USD 77.30 million by 2034, exhibiting a CAGR of 7.4% during the forecast period. Asia Pacific dominated the global levulinic acid market with a market share of 34.92% in 2025.
Levulinic acid is a bio-based platform chemical made from biomass sugars such as corn, bagasse, or cellulosic residues. It is used to make levulinate esters and other intermediates for solvents, coatings, plasticizers, fuel additives, agrochemical formulations, and selected fragrance and flavor applications. Demand grows as brands and formulators replace petroleum-based inputs with renewable options that still meet performance and safety requirements. Globally, the market expands steadily, rather than rapidly, as uptake depends on scaling cost-competitive capacity, consistent feedstock supply, and customer qualification for each application. Its strength lies in versatility, but volumes remain limited until downstream commitments deepen across major value chains.
The market is led by a relatively small group of bio-based and specialty chemical producers with pilot-to-commercial scale assets and established conversion technologies. Major players such as Qingdao Lachemyst International Trade Co., Ltd., Merck KGaA, Tokyo Chemical Industry Co., Ltd., SIMAGCHEM, and Shandong Xinhua Pharma, and other regional manufacturers focus on improving yield, lowering production cost, and ensuring consistent product quality and supply reliability, resulting in a moderately consolidated market characterized by steady but selective demand, customer qualification-driven adoption, and capacity that is expanding gradually rather than rapidly.
Download Free sample to learn more about this report.
LEVULINIC ACID MARKET TRENDS
Growing Demand for Verified Bio-Based Claims and Traceable Supply is Shaping Market
A clear trend in the market is that buyers increasingly want verified proof of bio-based content and clear information on raw material sourcing. Instead of accepting general “green” claims, many customers now request certifications, test results, and documentation that support renewable-content statements. This is prompting suppliers to enhance their traceability, quality documentation, and product labeling capabilities. As a result, companies that can provide consistent specifications along with credible proof of bio-based content are gaining an advantage in customer approvals and long-term supply discussions.
- According to the USDA BioPreferred Program, the USDA has established minimum biobased content standards for 139 product categories, reflecting the growing role of certification frameworks and traceability in biobased product procurement.
Download Free sample to learn more about this report.
MARKET DYNAMICS
MARKET DRIVERS
Growing Usage of Bio-Based Intermediates and Green Solvents Drives Levulinic Acid Demand
The levulinic acid market growth is driven by its use as a bio-based building block for solvents, additives, and specialty intermediates used in coatings, cleaners, agrochemical formulations, and fuel-related blends. As manufacturers aim to reduce fossil-based content while maintaining stable product performance, levulinic acid derivatives, such as levulinate esters, are adopted as practical alternatives in select applications. This creates a direct demand pull, as the wider use of these formulations increases the need for levulinic acid as a feedstock. Overall growth is steady and application-driven, supported by a gradual increase in production scale and customer approvals.
- According to the U.S. Department of Agriculture (USDA), biobased products contributed about USD 489 billion to the U.S. economy in 2021, up from USD 464 billion in 2020, reflecting a stronger demand pull for renewable chemical and material value chains.
MARKET RESTRAINTS
Higher Costs and Slow Customer Qualification Limit Levulinic Acid Adoption
Levulinic acid demand is restrained by higher costs and slower adoption than many petroleum-based solvents and intermediates. Commercial supply remains limited to a small number of producers, so buyers closely monitor long-term availability, price stability, and consistent quality. Many end users require extended testing, regulatory review, and supplier qualification before changing formulations in coatings, cleaners, plasticizers, or fuel-additive blends. Biomass feedstock variability and process yield swings can also affect batch consistency and delivered pricing. As a result, switching decisions are cautious and project-based, limiting rapid volume growth across large, cost-sensitive applications. This keeps penetration low outside premium, sustainability-driven niche markets.
- According to the U.S. Department of Energy (DOE), a bio-based levulinic acid route discussed in its project fact sheet “may produce levulinic acid for only USD 0.04 to USD 0.10 per pound,” highlighting how cost targets are central to commercialization and why cost competitiveness remains a key restraint when scaling levulinic acid across larger, price-sensitive applications.
MARKET OPPORTUNITIES
Scale-Up of Bio-Refineries and New Derivative Routes Are Creating Growth Opportunities
Levulinic acid has strong growth potential as more bio-based chemical plants scale up and improve process efficiency. Larger, more stable production can reduce costs and improve supply reliability, which are key requirements for wider customer adoption. This supports expansion into higher-volume derivative routes such as levulinate esters and other intermediates used in solvents, additives, and fuel-related blends. Many buyers are willing to test bio-based options, but long-term demand increases only when pricing and supply consistency are proven. As commercial capacity expands and more downstream routes mature, levulinic acid can transition from niche use to broader, repeat demand across multiple end uses.
- According to USDA Rural Development, its Biorefinery, Renewable Chemical, and Biobased Product Manufacturing Program provides loan guarantees of up to USD 250 million to support facilities that produce renewable chemicals and biobased products.
MARKET CHALLENGES
Feedstock Variability and Conversion Efficiency Create Cost and Quality Instability Risks
Levulinic acid producers face an ongoing challenge from the variability in biomass feedstocks, which can alter impurity levels and impact conversion yields. This increases purification needs, makes it harder to maintain consistent product specifications, and can raise unit production costs. Feedstock availability and pricing can also shift seasonally and by region, while energy and processing inputs add further cost pressure. In many end-use markets, customers are price-sensitive and slow to accept frequent price changes, which limits producers’ ability to pass through cost spikes fully. As a result, margin stability and supply consistency remain key hurdles during commercial scale-up.
- According to USDA NASS, U.S. corn-for-grain production was 14.9 billion bushels in 2024 (down 3% from 2023). As levulinic acid is made from biomass-based carbohydrate feedstocks, this kind of crop output swing can affect feedstock availability and cost for levulinic acid producers.
Segmentation Analysis
By Technology
Process Simplicity and Wider Commercial Use Supported Dominance of Acid Hydrolysis
Based on technology, the market is segmented into acid hydrolysis, biofine, and others.
The acid hydrolysis segment held a dominant levulinic acid market share in 2025. It remains the most widely used route as it is a proven and comparatively simple way to convert biomass-based sugars into levulinic acid. Producers favor it for its ease of scale-up, flexibility across feedstocks, and better control over consistent product quality. Since most buyers value stable specifications and dependable supply, acid hydrolysis-based production is better positioned to meet commercial needs, thereby maintaining its structural dominance.
The biofine segment is expected to witness the highest CAGR of 8.2% over the forecast period, driven by its higher conversion efficiency, improved product selectivity, and growing adoption in advanced biorefinery projects, despite higher capital requirements limiting widespread deployment.
To know how our report can help streamline your business, Speak to Analyst
By Application
Renewable Fuel Blending Supported Biofuels & Fuel Additives as a Key Demand Anchor
In terms of application, the market is categorized into biofuels & fuel additives, polymers & resins, cosmetics & personal care, pharmaceutical, agrochemical, and others.
The biofuels & fuel additives segment held a leading share in 2025 as levulinic acid can be converted into fuel-related intermediates and additives that help increase renewable content and improve blend performance in selected use cases. As refiners and fuel blenders seek practical bio-based components, levulinic acid-derived routes are gaining interest, with specifications and policy support encouraging renewable blending. This creates a relatively stable demand base compared to smaller, more niche end uses, supporting steady consumption of levulinic acid.
- According to the U.S. EPA (Renewable Fuel Standard Set Rule), the total renewable fuel volume requirement for 2025 is 22.33 billion ethanol-equivalent gallons, supporting renewable blending demand for levulinic-acid-derived fuel additives.
The polymers & resins segment is expected to grow at a 7.7% CAGR over the forecast period.
Levulinic Acid Market Regional Outlook
By geography, the market is categorized into North America, Europe, Asia Pacific, Latin America, and the Middle East & Africa.
Asia Pacific
Asia Pacific Levulinic Acid Market Size, 2025 (USD Million)
To get more information on the regional analysis of this market, Download Free sample
Asia Pacific held the dominant position in 2025, valued at USD 14.09 million, and is expected to retain its leading role in 2026, reaching USD 15.29 million. Strong biomass availability, an expanding bio-based chemicals ecosystem, and a large-scale manufacturing base for solvents, additives, and specialty intermediates support the region’s leadership. Robust demand from fuel-additive pathways, agrochemical formulations, polymers and resins, and industrial solvent applications supports steady levulinic acid consumption, particularly as cost competitiveness improves and local producers scale capacity to serve high-volume, price-sensitive markets.
China Levulinic Acid Market
Based on Asia Pacific’s strong contribution and China’s large-scale industrial footprint, the China market reached USD 6.00 million in 2025, accounting for approximately 42.60% of global revenues. Demand is supported by China’s broad bio-based chemicals and downstream formulation base, including solvents and additives, agrochemical intermediates, and emerging fuel-additive and resin-related pathways, along with growing interest in renewable alternatives within the wider chemicals value chain.
India Levulinic Acid Market
India’s market in 2025 was valued at USD 2.42 million. Growth is supported by rising demand for bio-based solvents and intermediates in agrochemicals, coatings, and cleaners, as well as early interest in fuel additives. Expanding chemical manufacturing improves adoption and encourages supply chain investments nationwide.
North America
North America is a significant market, valued at USD 11.24 million in 2025. Demand is derived from the use of bio-based solvents and additives in coatings, industrial cleaners, agrochemical formulations, and emerging fuel additive blends. The region benefits from strong R&D, pilot-to-commercial scale projects, and buyer interest in certified biobased content. Growth remains selective as customers require qualification, and pricing must compete with established petro-based alternatives to facilitate broader adoption.
U.S. Levulinic Acid Market
The U.S. market in 2025 was valued at USD 9.11 million, accounting for approximately 81.06% of global revenues. Consumption is driven by demand for bio-based intermediates used in renewable solvents and additives for coatings and industrial cleaners, as well as agrochemical formulation inputs and emerging fuel-additive pathways that support renewable blending and lower-emission specifications.
Europe
Europe was valued at USD 10.52 million in 2025. The region is shaped by sustainability and chemical regulations, high energy costs, and scrutiny of supply chains. These factors raise production costs but also encourage the adoption of bio-based inputs. Demand from coatings, industrial cleaners, agrochemical formulations, and specialty intermediates supports ongoing levulinic acid consumption, particularly where renewable content compliance and low-VOC targets are relevant.
Germany Levulinic Acid Market
Germany’s market reached a valuation of USD 3.06 million in 2025, accounting for around 29.09% of global revenues. Demand is supported by strong chemical manufacturing and formulation industries, with growing use of bio-based solvents and intermediates in coatings, cleaners, and additives.
U.K. Levulinic Acid Market
The U.K. market in 2025 was valued at USD 1.82 million, accounting for roughly 17.30% of global revenues. Consumption is concentrated in bio-based solvents and formulation inputs for coatings and industrial cleaning products, along with smaller volumes associated with agrochemical formulations and specialty intermediates, where renewable content claims and compliance requirements support adoption.
Latin America and Middle East & Africa
The Latin America and the Middle East & Africa regions are expected to see moderate growth. Latin America was valued at USD 2.39 million in 2025, supported by the gradual uptake of bio-based solvents and intermediates in agrochemical formulations, coatings, and industrial cleaners, as well as early trials of renewable fuel-additive components. Demand is concentrated in Brazil and Mexico, with the majority of supply still import-led. In the Middle East & Africa, the market was valued at USD 2.11 million in 2025. Consumption remains niche, driven by specialty formulation needs, pilot bio-based initiatives, and procurement interest in certified biobased content, but limited local production keeps volumes small today.
GCC Levulinic Acid Market
The GCC market was valued at approximately USD 0.87 million in 2025, accounting for around 41.41% of regional revenues. Demand is supported by import-led supply for industrial formulations, coatings, and cleaning products, as well as the region’s role as a chemical distribution hub with early interest in renewable additives.
COMPETITIVE LANDSCAPE
Key Industry Players
Strategic Investment and Scale Efficiency Shape Market Competition
The levulinic acid industry operates in a concentrated, scale-sensitive environment, where specialized biomass conversion technology, stringent purification requirements, and consistent quality control create formidable entry barriers. This dynamic naturally limits new entrants and concentrates supply within a select group of experienced bio-based and specialty chemical producers.
Major companies, including Qingdao Lachemyst International Trade Co., Ltd., Merck KGaA, Tokyo Chemical Industry Co., Ltd., SIMAGCHEM, and Shandong Xinhua Pharma, are channeling efforts toward yield optimization, secure feedstock access, and strengthening downstream applications. Instead of aggressive capacity additions, companies are taking a measured approach, emphasizing reliability, cost efficiency, and incremental expansion to secure sustainable growth.
LIST OF KEY LEVULINIC ACID COMPANIES PROFILED
- Qingdao Lachemyst International Trade Co., Ltd (China)
- Hefei TNJ Chemical Industry Co., Ltd. (China)
- JINAN BOSS CHEM CO., LTD. (China)
- Merck KGaA (Germany)
- Tokyo Chemical Industry Co., Ltd. (Japan)
- Thermo Fisher Scientific Inc. (U.S.)
- SIMAGCHEM (China)
- Vigon International, LLC. (U.S.)
- LangFang Hawk Technology & Development Co, Ltd. (China)
- Shandong Xinhua Pharma (China)
KEY INDUSTRY DEVELOPMENTS
- June 2021: Vigon International, LLC. acquired by Azelis, strengthening distribution reach and commercial support, which can improve supply reliability and market access for Vigon’s specialty ingredients portfolio, including levulinic acid.
REPORT COVERAGE
The global levulinic acid market analysis provides an in-depth study of market size & forecast by all the market segments included in the report. It includes details on market dynamics and trends expected to drive the market during the forecast period. It offers information on technological advancements, new product launches, key industry developments, and partnerships, mergers & acquisitions. The market research report also includes a detailed competitive landscape, including market share and profiles of key players.
Request for Customization to gain extensive market insights.
Report Scope & Segmentation
|
ATTRIBUTE |
DETAILS |
|
Study Period |
2021-2034 |
|
Base Year |
2025 |
|
Estimated Year |
2026 |
|
Forecast Period |
2026-2034 |
|
Historical Period |
2021-2024 |
|
Growth Rate |
CAGR of 7.4% from 2026 to 2034 |
|
Unit |
Value (USD Million) Volume (Kiloton) |
|
Segmentation |
By Technology, Application, and Region |
|
By Technology |
· Acid Hydrolysis · Biofine · Others |
|
By Application |
· Biofuels & Fuel Additives · Polymers & Resins · Cosmetics & Personal Care · Pharmaceutical · Agrochemical · Others |
|
By Region |
· North America (By Technology, Application, and Country) o U.S. (By Application) o Canada (By Application) · Europe (By Technology, Application, and Country /Sub-region) o Germany (By Application) o U.K. (By Application) o France (By Application) o Italy (By Application) o Spain (By Application) o Rest of Europe (By Application) · Asia Pacific (By Technology, Application, and Country /Sub-region) o China (By Application) o India (By Application) o Japan (By Application) o South Korea (By Application) o Rest of Asia Pacific (By Application) · Latin America (By Technology, Application, and Country /Sub-region) o Brazil (By Application) o Mexico (By Application) o Rest of Latin America (By Application) · Middle East & Africa (By Technology, Application, and Country /Sub-region) o GCC (By Application) o South Africa (By Application) o Rest of Middle East & Africa (By Application) |
Frequently Asked Questions
Fortune Business Insights says that the global market size was valued at USD 40.34 million in 2025 and is projected to reach USD 77.30 million by 2034.
Recording a CAGR of 7.4%, the market is slated to exhibit steady growth during the forecast period of 2026-2034.
The biofuels & fuel additives application segment led the market in 2025.
Asia Pacific held the highest market share in 2025.
Rising adoption of bio-based solvents and renewable chemical intermediates sustains levulinic acid demand.


- 2021-2034
- 2025
- 2021-2024
- 176
Get 30-60 hrs Free Customization
Expand Regional and Country Coverage, Segments Analysis, Company Profiles, Competitive Benchmarking, and End-user Insights.
Related Reports
-
US +1 833 909 2966 ( Toll Free )
-
Get In Touch With Us