Functional Food and Beverage Market Size, Share & Industry Analysis, By Type (Functional Cereals & Grains, Functional Dairy Products, Functional Bakery Products, Functional Fats & Oils, and Other Functional/ Fortified Foods), Distribution Channel (Supermarkets/ Hypermarkets, Convenience Stores, Online Retail, and Others) and Regional Forecast, 2026-2034

(Offer valid till 15th Jul 2026)
KEY MARKET INSIGHTS
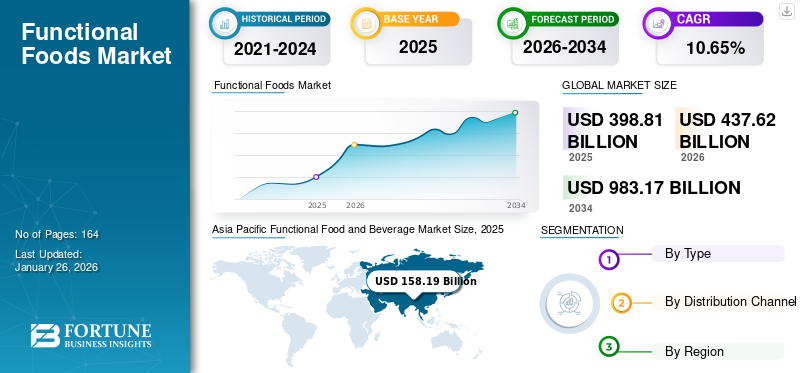
The global functional food and beverage market size was USD 398.81 billion in 2025 and is projected to grow from USD 437.62 billion in 2026 to USD 983.17 billion by 2034, at a CAGR of 10.65% over the forecast period (2026-2034). Asia Pacific dominated the functional food and beverage market with a market share of 39.67% in 2025. The functional foods market in the U.S. is projected to grow significantly, reaching an estimated value of USD 117.22 billion by 2032, driven by increased adoption of foods rich in nutritional and functional substances by health-conscious consumers.
Functional foods and beverages are enriched with functional nutrients, in addition to the basic nutritional value of the product, to provide multiple health-related benefits. These nutrients include amino acids, vitamins, minerals, proteins, fatty acids, and prebiotics. Functional products have gained importance in recent years due to the increased awareness among consumers. In current times, when a pandemic such as COVID-19 has hit the world and everyone is concerned about boosting their immunity, functional beverage & Food products are becoming immensely popular.
The sudden outbreak of the coronavirus pandemic has had a wholesome impact on raw ingredient sourcing, manufacturing, farming, processing, packaging, and shipping of functional food and beverage. The strict lockdown imposition across several economies to stop the spread of the virus has negatively affected the production and distribution of these products in the initial months as production plants/factories underwent staggered operations and partial or complete closures. However, with increased relaxations in protocols made to deal with COVID-19, the market has gained its pace. Another problem faced by the industry has been the restricted export of some active nutraceutical ingredients across major importing and exporting countries, such as China, India, and the US. The functional food and drink market growth also suffers from the logistical and associated economic impacts of the pandemic.
However, the effects are uneven across markets and not all are negative. Across many regions, the demand for functional or fortified foods has increased due to the positive and intensive marketing by companies and recommendations by health specialists such as doctors, nutritionists, and others. The efforts by market players and distribution channels, such as tapping more intensively into the digital space to deal with the pandemic, are resulting in increased sales of these products. For instance, in November 2020, Amazon introduced its online grocery store, Amazon Fresh, in four more cities in India, including Kolkata, Ahmedabad, Pune, and Chennai.
Download Free sample to learn more about this report.
Global Functional Food and Beverage Market Overview
Market Size & Forecast:
- 2025 Market Size: USD 398.81 billion
- 2026 Market Size: USD 437.62 billion
- 2034 Forecast Market Size: USD 983.17 billion
- CAGR: 10.65% from 2026–2034
Market Share:
- Asia Pacific dominated the functional food and beverage market with a market share of 39.67% in 2025.
- Functional dairy products led the market owing to rising demand for probiotic-rich and digestive health-boosting items.
- Online retail is projected to grow at the fastest rate due to increased e-commerce adoption post-pandemic.
Key Country Highlights:
- U.S.: Functional food market expected to reach USD 117.22 billion by 2032, driven by consumer preference for nutrient-rich diets.
- India: Government initiatives like fortified food schemes under Poshan Abhiyan are strengthening the functional food sector.
- China: Export restrictions during COVID-19 impacted ingredient availability but rising domestic demand is fueling recovery.
- Thailand: Fonterra’s collaboration with 7-Eleven expanded RTD functional milk beverages across 14,000 stores.
- Germany: Strict regulations ensure high-quality, safe functional products, enhancing consumer trust and market stability.
- Australia: Demand for probiotic and hemp-infused functional beverages continues to rise.
Functional Food and Beverage Market Trends
Rising Spending on Healthy & Nutritious Diet Products to Fuel Market Growth
The functional food and beverage market trends are driven by the rising demand for healthy and nutrition-rich diets. Evolving lifestyles and increasing incomes of consumers across the world have fueled the demand for products with superior nutritional profiles. Functional beverages, for instance, are designed to be consumed on-the-go, providing enhanced nutrition. Increasing product development and innovation activities, the availability of a wide variety of products, especially across e-commerce platforms, and the adoption of unique promotional strategies by market players are collectively furthering the growth of this market.
Download Free sample to learn more about this report.
Functional Food and Beverage Market Growth Factors
Growing Consumption of Nutrient-enriched Foods to Improve Overall Health and Well-being to Fuel the Market
The increasing demand for nutrient-enriched foods, due to hectic lifestyles and the rising awareness of their health benefits among consumers, is predicted to drive the market growth. There is a growing demand for on-the-go snacks containing additional nutrients that provide instant nutrition. Consumer interest in diet and health has increased the demand for functional foods. According to the U.S. Department of Agriculture’s Supplemental Nutrition Assistance Program (SNAP), more than two third of the 42 million Americans prefer to eat more healthy food and beverages. Consumers are inclined towards foods containing functional ingredients to reduce the risk of certain health conditions, such as obesity, weight management, diabetes, and cardiovascular diseases. Hectic lifestyles and increasing stress have contributed to the increasing prevalence of such health disorders. Various functional food trends, such as the rising demand for hemp-infused foods and beverages, probiotics, and prebiotics, are becoming popular and boosting the growth of this market.
Innovation and New Product Developments to Aid Growth
Increasing research and development activities to introduce innovative functional food and beverage products are responsible for driving the growth of this market. Companies are creating products that suit growing consumer needs. Manufacturers are developing functional confectioneries such as gummies and toffees for children, nutrition bars, and functional drinks that attract fitness enthusiasts and consumers looking for quick nutrition. Consumers are increasingly becoming aware of their digestive health, driving innovation in probiotic product offerings. Due to rising health consciousness among people, functional foods are experiencing striking demand growth across the globe.
The development of novel technologies for the formulation of functional food products is also driving product innovations in the global market. Technologies such as encapsulation technology, enzyme technology, vacuum impregnation technology, and edible coating technology are increasingly being utilized for the development of functional foods & beverages. Enzymes such as lipases can be used for the production of certain fatty acids as flavoring agents and antioxidant esters. Likewise, encapsulation in probiotics allows storage at ambient temperature, higher enhanced water activity, and reduces the loss of viability. Manufacturers are developing innovative products by using such technologies to keep up with the market demand. For instance, Fonterra Co-operative Group Limited, a New Zealand dairy products manufacturing company, launched new ready-to-drink (RTD) products under its Anchor and Fernleaf brands. The company collaborates with a convenience store chain, 7-Eleven, to launch its two functional milk beverages, Actif-Fiber and Anchor Beaute, across 14000 stores across Thailand.
RESTRAINING FACTORS
Off-taste and Flavor of Functional Ingredients to Hamper Market Growth
Functional ingredients, such as botanical extracts and herbs, when added to foods & beverages, generally impart an off or bitter taste to the product. Taste is a critical factor in the purchase decision, even when consumers are looking for healthy products. The challenge faced in masking the bitterness, off-tastes, and undesirable flavors of some botanical extracts and herbs is impeding the growth of the market.
Manufacturers use various approaches, such as the utilization of taste and flavor modifiers, to tackle these challenges. Flavor addition for the reduction of bitterness and taste masking is one of the most significant trends in the functional food and beverage industry. Flavors that complement functional food ingredients and nutrients added to the product are mostly used for masking purposes. For example, citrus flavors and astringent berry flavors work especially well with antioxidant fortifications as they blend well with the acidity that is inherent in vitamin C and other antioxidant ingredients. Natural fruit flavors are generally used in functional beverages and food due to the rising popularity of plant-based ingredients.
Functional Food and Beverage Market Segmentation Analysis
By Type Analysis
Functional Dairy Products are the Leading Types in the Global Marketplace
The market segments for functional foods and drinks, based on type, include functional dairy products as the leading product type. The functional dairy products segment is projected to dominate the market with a share of 41.49% in 2026. Increased consumer inclination towards aiding digestive health has contributed to raising the demand for prebiotics and probiotics dairy products. The higher affordability of functional dairy products such as yogurt is further boosting its demand across developing economies where per capita income and spending on health food products are comparatively lower.
The cereal and grain segment is another important segment that is generating the highest revenue after functional dairy products. The fortification of cereals & grains is one of the most effective methods to tackle nutrient deficiencies. Governments and regulatory authorities across the world have been taking initiatives to address the growing concern of nutrient deficiencies among populations with fortified foods. The addition of iodine in salt, vitamin D in milk, and vitamin B and iron in flours and grains are some of the examples of food fortification. For instance, the Government of India allocated a total budget of INR 174.64 crores (approx., USD 21.06 million) for a period of three years from 2019-20 under the pilot scheme under PM’s Poshan Abhiyan. The government aims to provide milk, oil, wheat, rice and salt fortified in India and reach out to more than 50 crore beneficiaries under this program.
The demand for functional fats & oils is rising at a crucial pace as they are major ingredients in the preparation of a variety of cuisines across the globe. Moreover, the increased awareness regarding the health benefits of functional fats such as Omega-3 fatty acids is aiding the product segment sales.
By Distribution Channel Analysis
To know how our report can help streamline your business, Speak to Analyst
Online Retail Segment to Grow at the Fastest Pace
The e-commerce boom has effectively provided strong headwinds to online retail sales of functional food products. After the onset of the pandemic, key manufacturers are more actively tapping popular e-commerce platforms with a mix of attractive discounts, robust sales & support, and an enhanced shopping experience for consumers. This factor is predicted to support online platforms to emerge as one of the fastest-growing distribution channels across the globe.
Mass merchandisers (supermarkets/hypermarkets) are the leading distribution channel segment for functional food and beverages. The supermarkets/hypermarkets segment is projected to dominate the market with a share of 43.83% in 2026. These giant retailers are augmenting their market penetration by targeting underserved locations, offering distinct retail shelves to superior nutritional products, and developing a bundling strategy for such products.
Convenience stores have emerged as a major distribution channel in the global market as they offer convenience as well as specialized functional products from different brands. The easy accessibility of these stores to consumers is also boosting the sales of functional beverage and food through this channel.
REGIONAL INSIGHTS
Asia Pacific Functional Food and Beverage Market Size, 2025 (USD Billion)
To get more information on the regional analysis of this market, Download Free sample
Asia Pacific
Asia Pacific is the Leading Region with the Fastest Growth Projection
The Asia Pacific market value stood at USD 158.19 billion in 2025 and is projected to register a CAGR of 10.82% during 2026-2034, owing to the rising health awareness and increasing discretionary incomes in the region. The consumption of fast food is causing adverse changes in health conditions and increasing the prevalence of chronic diseases, such as diabetes and obesity. Rising awareness about these health issues is driving consumers to spend more on nutritional foods to improve overall well-being. The Japan market is projected to reach USD 45.22 billion by 2026, the China market is projected to reach USD 60.4 billion by 2026, and the India market is projected to reach USD 32.51 billion by 2026.
Europe
Europe contributed 18.62% to the global market in 2025, with a valuation of USD 74.25 billion, and is projected to reach USD 81.42 billion in 2026. In Europe, the demand for foods with functional benefits is progressing at a stable pace owing to the increasing investments by market players in research, innovation, and the marketing of products. The stringent regulations for regulating nutraceutical products in the region also assure only safe and high-quality functional products are accessible to consumers. The UK market is projected to reach USD 21.35 billion by 2026, while the Germany market is projected to reach USD 17.89 billion by 2026.
North America
The North America market generated USD 98.41 billion in 2025, representing 24.68% of the global market landscape, and is expected to reach USD 107.16 billion in 2026. The position of North America in the functional food and beverage market share is being augmented by a growing number of health-conscious consumers who are opting for foods rich in nutritious and functional substances. The increased consumer focus on enhancing physical, mental, and overall health through a healthy diet is propelling the market’s growth across the region. Moreover, the presence of giant food companies, such as Tyson Foods, General Mills, and others, in the region that is actively exploring their potential in the functional food & beverage space can further augment the regional market growth in the upcoming years. The U.S. market is projected to reach USD 73.52 billion by 2026.
Rest of the World
In 2025, Middle East & Africa held 3.02% of the global market, reaching a valuation of USD 12.05 billion, and is projected to grow to USD 13.21 billion in 2026. Latin America contributed approximately USD 55.91 billion to the global market in 2025, accounting for 14.02% share, and is expected to reach USD 61.35 billion in 2026.
To know how our report can help streamline your business, Speak to Analyst
List of Key Companies in Functional Food and Beverage Market
Moderately Consolidated Industry Structure to Influence Market Competition
The analysis of this market shows that at the global level, the market is moderately consolidated with a few prominent players, such as Danone S.A., General Mills, Nestle S.A., Glanbia Plc, and others, operating internationally. These players are focusing on research and innovation activities to cater to the growing consumer demands for innovative products.
The key companies are focused on mergers, acquisitions, new product launches, and are developing partnerships to consolidate their position. For instance, in December 2019, International Flavours and Fragrances Inc. and DuPont’s nutrition and bioscience division announced a merger to create high-value functional ingredients and solutions in the global food, beverage, health, and wellness market. New players are likewise entering the market to meet the growing demand for more affordable products, as functional foods become more mainstream. The arrival of new players in the market is responsible for intensifying competition within the market, which is acting as a positive factor for the growth of this market.
LIST OF KEY COMPANIES PROFILED:
- Danone S.A. (Paris, France)
- Nestle S.A. (Vevey, Switzerland)
- General Mills Inc. (Minnesota, United States)
- Glanbia Plc (Kilkenny, Ireland)
- Tyson Foods Inc. (Arkansas, United States)
- PepsiCo Inc. (New York, United States)
- Hearthside Food Solutions LLC (Illinois, United States)
- Celsius Holding, Inc. (Florida, United States)
- Arla Foods amba (Viby, Denmark)
- The Coca-Cola Company (Georgia, United States)
KEY INDUSTRY DEVELOPMENTS:
- September 2023: Yoplait, a dairy product manufacturing company, expanded its product offering by launching high protein yogurt products under its SKYR Energy brand. The new product contains real fruit pieces, vitamin B6 and vitamin D, and is available in two different flavors – Strawberry & Blackcurrant and Mango & Passion fruit.
- May 2023: Javo Beverage, one of the emerging beverage companies, introduced its new all-natural functional energy lemonades and flavored teas for food service operators. The company aimed to meet consumer demand for functional beverage products through this launch.
- April 2023: Hangobi, an American beverage manufacturer, launched fortified beverages in three basic flavors: Wake, Essential, and Calm. The company collaborates with several distributors, including KeHE, UNFI Supervalu, and C&S Wholesale, to distribute the products across New York.
- December 2020: Danone S.A. announced the launch of Oikos Pro Line that includes drinks and yogurt cups enriched with essential amino acids, proteins, and minerals required for building and maintaining strong bones and muscles. The product also claims to be a good source of calcium and will be made available in the U.S. market from January 2021.
- November 2020: Mars Inc. announced its plan to fully acquire the functional and healthy snacks company, KIND North America, to expand its business of functional foods across North America. Earlier, in 2017, the company had purchased a minority stake in KIND.
REPORT COVERAGE
The functional food and beverage market report provides qualitative and quantitative insights, along with intelligence on this market, and offers a detailed analysis of the size and growth rate for all possible segments in the market. Along with this, the report provides an elaborative analysis of the market dynamics and competitive landscape. Various key insights provided in the report include the overview of related markets, recent industry developments, such as mergers & acquisitions, the regulatory scenario in key countries, and key industry trends.
Request for Customization to gain extensive market insights.
Report Scope & Segmentation
|
ATTRIBUTE |
DETAILS |
|
Study Period |
2021-2034 |
|
Base Year |
2025 |
|
Estimated Year |
2026 |
|
Forecast Period |
2026-2034 |
|
Historical Period |
2021-2024 |
|
Unit |
Value (USD Billion) |
|
Growth Rate |
CAGR of 10.65% for 2026 to 2034 |
|
Segmentation |
By Type
By Distribution Channel
By Geography
|
Frequently Asked Questions
Fortune Business Insights says that the global market size was USD 398.81 billion in 2025 and is projected to reach USD 983.17 billion by 2034.
Growing at a CAGR of 10.65%, the market will exhibit steady growth during the forecast period (2026-2034).
The functional dairy products segment is expected to be the leading type in the market during the forecast period.
The rising demand for nutrient-enriched food to aid overall health is expected to drive the growth of the global market.
Nestle S.A., Danone S.A., General Mills Inc., Glanbia Plc, and The Coca-Cola Company are some of the top players in the market.
Asia Pacific is expected to hold the highest share in the global market.
The supermarket/hypermarket segment is expected to hold the dominant share in the global market.
Increasing consumer spending on healthy diet products is an emerging trend in the global market.


- 2021-2034
- 2025
- 2021-2024
- 164
-
(Offer valid till 15th Jul 2026)
Get 30-60 hrs Free Customization
Expand Regional and Country Coverage, Segments Analysis, Company Profiles, Competitive Benchmarking, and End-user Insights.
-
US +1 833 909 2966 ( Toll Free )
-
Get In Touch With Us