Captive Power Plant Market Size, Share & Industry Analysis, By Fuel Source (Coal, Natural Gas, Diesel/HFO, Renewable, and Others), By Capacity Range (Upto 10 MW, 10 to 50 MW, 51 to 150 MW, and Above 150 MW), By Technology (Gas Turbine, Reciprocating Engine, Combined Heat and Power (CHP), Renewable Microgrid, and Others), By End User (Cement, Metals & Minerals, Petrochemicals, Data Centers, Pulp & Paper, and Others), and Regional Forecast, 2026-2034
Captive Power Plant Market Size & Future Outlook
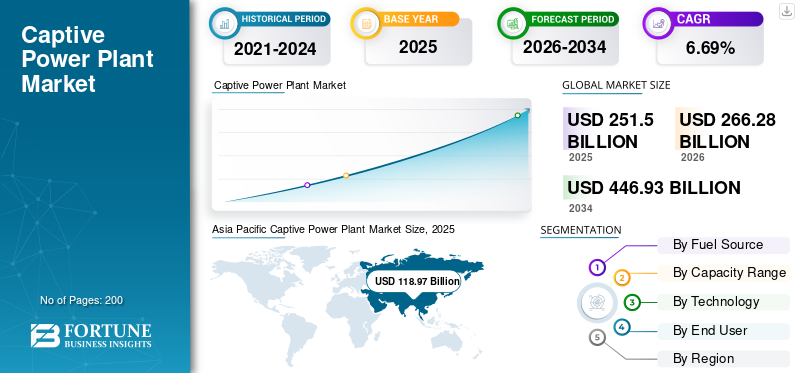
The global captive power plant market size was valued at USD 251.50 billion in 2025 and is projected to grow from USD 266.28 billion in 2026 to USD 446.93 billion by 2034, exhibiting a CAGR of 6.69% during the forecast period. Asia Pacific dominated the captive power plant market with a market share of 47.30% in 2025.
A major driver for the market is the rapid growth in industrial electricity consumption alongside persistent grid reliability issues in several economies. According to the International Energy Agency (IEA), the global electricity demand grew by around 2.2% in 2023, with industry accounting for roughly 42% of the total electricity consumption worldwide. In emerging economies such as India and parts of Southeast Asia, the industrial power demand has been rising at over 5% annually, while transmission and distribution losses remain above 15% in some regions. Frequent voltage fluctuations and outages can result in production losses running into thousands of dollars per hour for energy-intensive sectors such as steel, cement, and chemicals. To mitigate operational risks and control long-term energy costs, industries are increasingly investing in on-site captive power plants, ensuring uninterrupted supply and improved energy security.
- For instance, in January 2026, CIE Automotive India signed agreements to procure power from two captive solar projects totaling 8.3 MW being developed by AMPIN Energy for its manufacturing facilities in Maharashtra. One project (≈3.3 MW) will supply its Chhatrapati Sambhaji Nagar facility and the other (≈5 MW) will serve the Chakan plant. These captive solar plants support the company’s sustainability goals and expand localized renewable power use.
Some of the leading companies operating in the industry include General Electric Company (GE), Wärtsilä Oyj Abp, Siemens AG, Caterpillar Inc., and others. General Electric Company (GE) is a global energy technology leader providing advanced gas turbines, steam turbines, generators, and integrated power solutions for industrial and utility applications. In the captive power plant segment, GE supports on-site and distributed generation projects by delivering high-efficiency equipment and turnkey solutions tailored to energy-intensive industries worldwide.
Download Free sample to learn more about this report.
CAPTIVE POWER PLANT MARKET TRENDS:
Flexibility and Grid-Services Monetization are Key Market Trends
Captive power generation plants are increasingly engineered for operational agility rather than steady baseload output. Operators are upgrading governors, excitation systems, and plant control logic to enable sub-minute ramp rates and seamless transition between grid-connected and islanded modes without disrupting sensitive process loads. This allows industrial facilities such as refineries, steel mills, and semiconductor plants to momentarily reduce or export power in response to grid operator signals while maintaining internal power quality standards.
Instead of oversizing units purely for redundancy, facilities are optimizing spinning reserve margins and using battery energy storage or fast-start gas engines to provide frequency response and voltage stabilization. Advanced energy management systems coordinate load shedding sequences, prioritize critical feeders, and automate re-synchronization after grid disturbances.
MARKET DYNAMICS
MARKET DRIVERS:
Industrial Energy Cost Volatility and Supply Risk Mitigation to Drive the Market Growth
Escalating grid tariffs, cross-subsidy surcharges, and unpredictable fuel adjustment charges are pushing energy-intensive industries to internalize power generation, driving captive power plant market growth. For sectors such as cement, chemicals, metals, and data infrastructure, electricity is a major input cost directly tied to production margins. Even short-duration outages or voltage fluctuations can damage equipment, interrupt batch processes, or cause material losses. Captive power units provide cost visibility through controlled fuel procurement and long-term supply contracts, reducing exposure to tariff revisions and grid curtailments.
In regions where transmission congestion or peak-demand restrictions are common, industries face load shedding or mandatory consumption caps. Establishing captive generation ensures continuity of operations, particularly for facilities operating continuous processes such as smelting, petrochemicals, or pharmaceuticals. Moreover, internal generation enables better alignment of power supply with process load profiles, improving operational stability and minimizing downtime.
MARKET RESTRAINTS:
Regulatory Complexity and Capital Lock-In to Hamper the Market Demand
Captive power projects face layered regulatory approvals that vary across jurisdictions, often involving generation licensing, environmental clearances, fuel linkage permissions, and grid interconnection agreements. Changes in open-access rules, cross-subsidy charges, or banking provisions can materially alter the economics of surplus power export, creating uncertainty over long-term returns. In some regions, stricter emissions norms and water-use regulations require additional investments in flue gas treatment, cooling systems, and continuous monitoring infrastructure, increasing compliance overhead.
Beyond regulatory hurdles, captive plants demand substantial upfront capital and long asset lifecycles, typically spanning 15–25 years. This capital lock-in limits financial flexibility, especially in industries exposed to cyclical demand. If production volumes decline or processes electrify differently over time, installed generation capacity may become underutilized.
MARKET OPPORTUNITIES:
Decarbonization-Linked Industrial Electrification and Green Captive Integration to Present Excellent Market Opportunities
Industrial decarbonization targets are creating significant opportunities for next-generation captive power configurations. According to the International Energy Agency (IEA), in 2023, industry accounted for roughly 30–35% of the global electricity consumption (IEA, Electricity Information 2023), highlighting the scale at which industrial electrification can influence energy systems. As decarbonization targets tighten, a growing share of low- and medium-temperature industrial heat demand is shifting toward electrified solutions, creating strong alignment with renewable-based captive generation.
Download Free sample to learn more about this report.
Further, according to the IEA (2023) and the World Bank’s State and Trends of Carbon Pricing 2023, around 23% of global greenhouse gas emissions were covered by carbon pricing mechanisms in 2023. This increased the financial incentive for industries to integrate low-carbon captive power to manage compliance exposure.
MARKET CHALLENGES:
Operational, Fuel, and Compliance Constraints to Present Significant Challenges for Market Growth
Captive power plant development faces structural and operational challenges that extend beyond capital investment. One of the primary difficulties is long-term fuel security and price predictability. Industries dependent on coal or natural gas must manage supply linkages, transportation bottlenecks, and fuel quality inconsistencies that directly affect plant efficiency and maintenance cycles. Gas-based captive plants, in particular, are vulnerable to allocation priorities and import price volatility, which can disrupt projected operating costs. Another challenge lies in grid synchronization and technical integration. Maintaining stable frequency and voltage while switching between islanded and grid-connected modes requires advanced protection systems and skilled operational oversight.
Segmentation Analysis
By Fuel Source
Coal Segment Dominated Owing to its Cost Advantage and Base-Load Reliability
Based on segmentation by fuel source, the market is classified into coal, natural gas, diesel/HFO, renewable, and others.
In 2025, the coal segment dominated the market share. Coal remains dominant primarily due to its cost stability and ability to deliver continuous base-load generation. For energy-intensive industries such as cement, steel, aluminum, and chemicals, uninterrupted high-load operation is critical to maintaining process integrity and equipment efficiency. Coal-fired captive units provide steady output without dependence on external fuel allocation cycles that affect natural gas in several regions.
- The renewable segment is experiencing the highest growth and is expected to grow at a CAGR of 8.15% over the forecast period.
To know how our report can help streamline your business, Speak to Analyst
By Capacity Range
10 to 50 MW Segment Led the Market as it Offers Optimal Scale for Industrial Load Matching
Based on capacity range, the market is classified into upto 10 MW, 10 to 50 MW, 51 to 150 MW, and above 150 MW.
In 2025, the 10 to 50 MW segment dominated the global market. Heavy manufacturing units such as cement plants, integrated steel mills, refineries, paper mills, and chemical complexes often operate with connected loads that fall within this bracket. Installing generation within this range allows operators to meet core baseload requirements while retaining flexibility to import supplemental power during peak expansion or maintenance periods.
- The 51 to 150 MW segment is expected to grow at a CAGR of 6.35% during the analysis period.
By Technology
Gas Turbine Segment Dominated Owing to Suitability in Fluctuating Demand Profiles
On the basis of technology, the market is classified into gas turbine, reciprocating engine, combined heat and power (CHP), renewable microgrid, and others.
In 2025, the gas turbines segment dominated the global captive power plant market share. Unlike conventional steam-based systems, gas turbines can reach full load within minutes, making them suitable for industries with fluctuating demand profiles or frequent load variations. This responsiveness supports uninterrupted production in sectors such as oil and gas, petrochemicals, and manufacturing, where even minor power instability can cause process disruptions or material losses. Gas turbines also offer higher power density, requiring comparatively less installation space, an important advantage for industrial sites with limited footprint. Their modular design allows phased capacity additions aligned with production expansion plans.
- The renewable microgrid segment is expected to grow at a CAGR of 8.26% during the forecast period.
By End User
Metals & Minerals Segment Dominated the Market due to High Energy Intensity and Continuous Operations
On the basis of end user, the market is classified into cement, metals & minerals, petrochemicals, data centers, pulp & paper, and others.
In 2025, the metals & minerals segment dominated the market due to its extremely high energy intensity and need for uninterrupted operations. Processes such as smelting, electrolysis, rolling, and mineral refining require stable, high-load electricity over extended production cycles. Even brief voltage fluctuations or outages can solidify molten metal, damage refractory linings, or disrupt electrochemical reactions, leading to costly downtime and equipment losses. Electricity can account for a substantial share of operating expenses in aluminum smelters, ferroalloy plants, and integrated steel facilities, making cost control and supply reliability strategic priorities. Captive power enables these facilities to stabilize energy costs, optimize load factors, and synchronize generation with furnace cycles and peak process demand.
- The data centers segment is expected to grow at a CAGR of 8.89% over the analysis period.
Captive Power Plant Market Regional Analysis
By geography, the market is categorized into North America, Europe, Asia Pacific, Latin America, and the Middle East & Africa.
Asia Pacific
Asia Pacific Captive Power Plant Market Size, 2025 ( USD Billion )
To get more information on the regional analysis of this market, Download Free sample
Asia Pacific reached a value of USD 118.97 billion in 2025 and secured the largest share of the market. Captive plants are particularly popular in the Asia Pacific due to rapid industrialization, grid reliability gaps, and high energy demand concentration in manufacturing clusters. Countries such as China, India, Indonesia, and Vietnam host large steel, cement, chemicals, and textile industries where continuous power is critical to avoid production losses. In several emerging economies, transmission infrastructure expansion has not kept pace with industrial growth, leading to voltage instability and periodic load shedding. Captive generation ensures operational continuity and protects against downtime costs.
Japan Captive Power Plant Market
The Japan market reached around USD 13.34 billion in 2025, accounting for roughly 5.30% of global revenues. In Japan, captive plants are widely adopted by industrial facilities to ensure energy security and price stability amid high fuel import dependence and grid supply constraints.
China Captive Power Plant Market
The China market is projected to be significant worldwide. The 2025 revenues for the country reached around USD 39.65 billion, representing roughly 15.77% of the global market.
India Captive Power Plant Market
The India market touched around USD 28.85 billion in 2025, accounting for roughly 11.47% of global revenues.
North America
North America held the second-highest share in 2025, valued at USD 55.65 billion, and is expected to account for a significant share in 2026 with USD 58.47 billion. In North America, captive power adoption is driven by a combination of reliability needs, energy cost management, and decarbonization pressures unique to the region’s industrial and commercial landscape. The U.S. and Canada host dense clusters of energy-intensive sectors, including chemicals, metals, automotive, and data centers, where even brief grid interruptions can result in significant production losses, equipment damage, and contractual penalties. This reliability imperative is heightened by aging transmission infrastructure and increasing peak demand pressures. For example, ERCOT reported record grid demand exceeding 85 GW in 2023 in Texas alone, with projections suggesting continued upward pressure on capacity requirements.
U.S. Captive Power Plant Market
Based on North America’s strong contribution and the U.S. dominance within the region, the U.S. market reached around USD 47.84 billion in 2025, accounting for roughly 19.02% of the global market size.
Europe
Europe is projected to record a growth rate of 6.37% over the forecast period, which is the third-highest among all regions. The market reached a valuation of USD 45.65 billion in 2025. According to the European Commission, in Europe in 2023, industry accounted for about 24.6% of total final energy consumption, with electricity and natural gas industry growth together making up nearly two-thirds (32.6% and 31.3% respectively) of that consumption, underscoring the region’s substantial industrial energy demand. Electricity generation in the EU reached around 2,637 TWh, with renewables (wind, solar, hydro) contributing over 40% of net generation, reflecting the rapid shift toward low-carbon power sources.
Germany Captive Power Plant Market
In 2025, the Germany market reached a value of around USD 11.45 billion and is estimated to touch around USD 12.14 billion in 2026, representing roughly 4.55% of the global revenues.
Latin America
The Latin America market is expected to witness moderate growth during the forecast period. The market reached a valuation of USD 9.81 billion in 2025. In Latin America, captive plants are adopted primarily to address grid instability and regional supply gaps, particularly in mining and resource-intensive industries. Countries such as Brazil, Chile, and Peru see strong deployment in metals, cement, and oil & gas sectors, where remote project locations limit reliable grid access.
Brazil Captive Power Plant Market
The Brazil market reached a valuation of around USD 4.56 billion in 2025, representing roughly 1.81% of the global market.
Middle East & Africa
The Middle East & Africa market is expected to witness significant growth during the forecast period. The regional market reached a valuation of USD 21.43 billion in 2025. In the Middle East and Africa, captive plants are widely used in oil & gas, petrochemicals, mining, and large industrial zones where continuous high-load operations are critical. Abundant natural gas availability in Gulf countries supports gas-based captive and cogeneration systems, while in parts of Africa, self-generation compensates for grid unreliability and capacity shortages. These systems enhance energy security, cost control, and operational resilience for industrial facilities.
GCC Captive Power Plant Market
The GCC market reached around USD 10.39 billion in 2025, representing roughly 4.13% of the global market.
COMPETITIVE LANDSCAPE
Key Industry Players:
Major Players to Deploy Targeted Growth Strategies to Consolidate their Presence
The global captive power plant market holds a consolidated market structure, constituting prominent players such as General Electric Company (GE), Wärtsilä Oyj Abp, Siemens AG, Caterpillar Inc., and others. Companies operating in the market are deploying targeted growth strategies centered on strengthening their technical capability, product portfolio, expanding manufacturing footprint, and other areas.
- For instance, in August 2024, GE Vernova (a GE power generation unit) continued to lead in global gas turbine demand, holding the largest share of gas turbines under construction worldwide, with around 55 GW in the pipeline. This reflects GE’s significant role in supporting new captive and utility-scale gas-fired projects, driven by industry demand for flexible and hydrogen-ready turbines amid energy transition imperatives. GE’s strong order book underscores ongoing investment in reliability-driven generation assets.
Other key players in the global market include Mitsubishi Heavy Industries Ltd., Bharat Heavy Electricals Limited (BHEL), Tata Power, Adani Power, and others. These players are expected to prioritize partnerships and new product launches to enhance their global market share during the analysis period.
LIST OF KEY CAPTIVE POWER PLANT COMPANIES PROFILED:
- General Electric Company (GE) (U.S.)
- Wärtsilä Oyj Abp (Finland)
- Siemens AG (Germany)
- Caterpillar Inc. (U.S.)
- Mitsubishi Heavy Industries Ltd. (Japan)
- Bharat Heavy Electricals Limited (BHEL) (India)
- Tata Power (India)
- Adani Power (India)
- GMR Group (India)
- Thermax Ltd. (India)
KEY INDUSTRY DEVELOPMENTS:
- February 2025: Wärtsilä reported strong growth in orders for flexible power plants that serve industrial and grid-balancing roles. Wärtsilä’s modular engine systems are increasingly selected for captive power configurations that require fast ramping and multi-fuel capability, especially where intermittent renewables are integrated. This trend highlights industrial customers’ focus on on-site resilience combined with emissions optimization through hybridization with storage and biofuel compatibility.
- September 2024: Tata Power announced plans to invest up to USD 9 billion to quadruple renewable generation capacity to over 20 GW. While the focus is on grid-connected renewables, the company’s strategy also aligns with expanding behind-the-meter power resources, including captive and hybrid systems integrating solar and storage to serve industrial and commercial customers.
- August 2024: Mitsubishi Power secured a landmark contract to supply advanced J-class gas turbine technology for the SATORP Strategic Expansion project in Saudi Arabia. The plant will deliver both electricity and steam for petrochemical operations, emphasizing efficiency, reliability, and sustainability. Mitsubishi’s role underscores continued global investments in high-efficiency gas-fired captive and industrial power solutions as part of energy transition strategies.
- June 2024: Siemens Energy (part of the Siemens AG group) and GE Vernova announced support for two new 2 GW combined-cycle power plants in Saudi Arabia, expanding reliable energy infrastructure. Siemens will engineer, supply, and service gas turbines and related components at Taiba-2 and Qassim-2 facilities. These projects are expected to transition to combined cycle operations by 2027 and support Saudi Vision 2030 goals while reducing emissions compared with oil-fired systems.
- June 2023: Thermax’s subsidiary, First Energy Private Limited (FEPL), commissioned a 45.80 MW wind-solar hybrid captive power plant in Gujarat in June 2023. The facility, combining 24.3 MW wind and 21.5 MW solar capacity, is expected to reduce emissions by over 111,700 tonnes of CO₂ annually while supplying decentralized power for industrial consumption.
REPORT COVERAGE
The global captive power plant market analysis provides an in-depth study of the market size & forecast by all the market segments included in the report. It includes details on the market dynamics and the market trends expected to drive the market over the forecast period. It offers information on the technological advancements, new product launches, key industry developments, and details on partnerships, mergers, and acquisitions. The research report also encompasses a detailed competitive landscape with information on the market share and profiles of key operating players.
Request for Customization to gain extensive market insights.
Report Scope & Segmentation
| ATTRIBUTE | DETAILS |
| Study Period | 2021-2034 |
| Base Year | 2025 |
| Forecast Period | 2026-2034 |
| Historical Period | 2021-2024 |
| Growth Rate | CAGR of 6.69% from 2026-2034 |
| Unit | Value (USD Billion) |
| Segmentation | By Fuel Source, Capacity Range, Technology, End User, and Region |
| By Fuel Source |
|
| By Capacity Range |
|
| By Technology |
|
| By End User |
|
| By Geography |
|
Frequently Asked Questions
Fortune Business Insights says that the global market value stood at USD 251.50 billion in 2025 and is projected to reach USD 446.93 billion by 2034.
In 2025, the North America market value stood at USD 55.65 billion.
The market is expected to exhibit a CAGR of 6.69% during the forecast period of 2026-2034.
The coal segment led the market by fuel source in 2025.
Rising industrial energy demand, grid reliability concerns, fuel cost volatility, and decarbonization targets are the key factors driving the market.
General Electric Company (GE), Wärtsilä Oyj Abp, Siemens AG, and others are some of the prominent players in the market.
Asia Pacific dominated the market in 2025.
Energy cost control, uninterrupted power supply needs, regulatory flexibility, and integration of renewable hybrid systems are major factors expected to favor plant adoption.


- 2021-2034
- 2025
- 2021-2024
- 200
Get 30-60 hrs Free Customization
Expand Regional and Country Coverage, Segments Analysis, Company Profiles, Competitive Benchmarking, and End-user Insights.
Related Reports
-
US +1 833 909 2966 ( Toll Free )
-
Get In Touch With Us