Digital Map Market Size, Share & Industry Analysis, By Map Type (Dynamic Maps, Static Maps, and 3D & Immersive Maps), By Location (Indoor, Outdoor, & Metaverse), By Technology (Geographic Information System (GIS), LiDAR, Digital Orthophotography, Aerial Photography, & GPS), By Application (Tracking and Telematics, Real-time Location Data Management, Risk Assessment and Disaster Management, Geocoding and Geo-positioning, and Route Planning and Optimization), By End-user (Automotive & Transportation, Logistics & E-commerce, & Others), and Regional Forecast, 2026-2034
KEY MARKET INSIGHTS
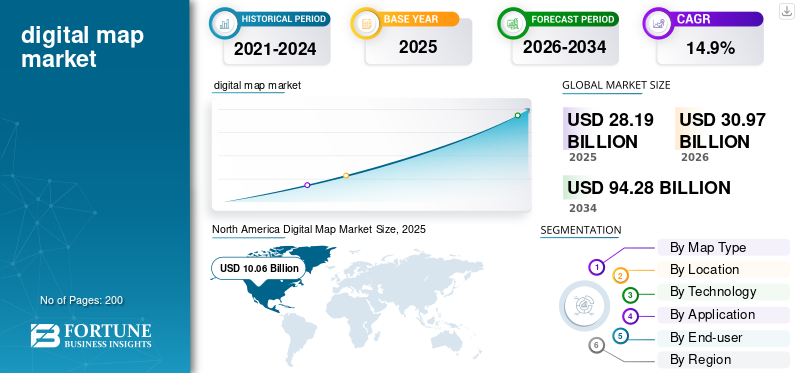
The global digital map market size was valued at USD 28.19 billion in 2025. The market is projected to grow from USD 30.97 billion in 2026 to USD 94.28 billion by 2034, exhibiting a CAGR of 14.9% during the forecast period. North America dominated the digital map market with a market share of 35.69% in 2025.
The digital map market is rapidly evolving as location intelligence becomes a cornerstone for innovation across multiple sectors. Increasing reliance on smart devices, connected vehicles, and IoT infrastructure is driving demand for more accurate, real-time, and interactive map visualization solutions. Unlike traditional maps, today’s digital maps offer dynamic updates, immersive visualizations, and deep integration with AI and cloud technologies, enabling new applications in autonomous navigation, urban planning mapping, and personalized location services.
In recent years, the proliferation of autonomous vehicles, smart city projects, and location-based marketing has accelerated the need for high-definition maps that go beyond basic navigation. Market leaders such as Google, HERE Technologies, Apple, and Microsoft are competing to deliver comprehensive geospatial platforms that combine advanced data analytics, seamless cross-device experiences, and scalable cloud infrastructures.
This growth is also driven by increasing partnerships between map providers and industries such as automotive, logistics, and retail, which utilize mapping data to optimize routes, enhance customer engagement, and improve operational efficiency. As the demand for smarter, context-aware mapping grows, the market is positioned for transformative growth driven by technological innovation and expanding use cases worldwide.
Download Free sample to learn more about this report.
IMPACT OF AI
Implementation of AI Capabilities to Fuel the Growth of the Market
Artificial intelligence is rapidly transforming the digital mapping market by automating data collection, enhancing map accuracy, and facilitating more frequent updates. AI algorithms can analyze satellite images, sensor data, and real-time traffic information to detect changes instantly, making maps more dynamic and reliable. For instance,
- In October 2025, Cantabria, Spain, is utilizing AI and computer vision to analyze decades of aerial imagery, enabling a small six-person GIS team to monitor beach overcrowding, vehicle pressure, forest recovery, and invasive species. The insights guide sustainable tourism and environmental protection across the region.
AI also enhances route optimization, predictive traffic modeling, and personalized location-based services, creating smarter and more context-aware user experiences. In sectors such as autonomous driving, it plays a crucial role in generating and maintaining high-definition maps that facilitate safe navigation. Overall, AI is elevating the speed, precision, and intelligence of modern mapping systems, driving the next wave of innovation in the market.
Digital Map Market KEY TAKEAWAYS
- 2025 Market Size: USD 28.19 billion
- 2026 Market Size: USD 30.97 billion
- 2034 Forecast Market Size: USD 94.28 billion
- CAGR: 14.9% from 2026–2034
- North America dominated the market with a 35.69% share in 2025.
- The Outdoor segment accounted for the largest market share in 2025.
- The GIS segment is projected to hold a 48.0% share in 2026.
North America
North America projected to reach USD 11.15 billion in 2026.
Europe
Europe market projected to reach USD 7.56 billion in 2026.
Asia Pacific
Asia Pacific market projected to reach USD 7.56 billion in 2026.
U.S.
U.S. market projected to reach USD 9.14 billion by 2026.
China
China market projected to reach USD 3.13 billion by 2026.
Read More
MARKET DYNAMICS
Digital Map MARKET TRENDS
Growing Integration of Augmented and Mixed Reality in Digital Mapping to be a Key Trend in the Market
Augmented reality and mixed reality are becoming increasingly integrated into digital mapping, transforming how users interact with their surroundings. By overlaying digital information such as directions, landmarks, and points of interest directly onto the real-world view, AR and MR create a more intuitive and visually engaging navigation experience. For instance,
- In January 2025, engineers at the University of Waterloo developed the Smart Infrastructure Metaverse. This AR/VR system utilizes 3D scans and digital mapping to enable onsite and remote inspectors to view the same structure simultaneously. By overlaying holograms and AI-analyzed data onto real-world infrastructure, the system enables faster and more accurate assessments.
This trend is particularly influential in areas such as pedestrian navigation, where users can follow visual cues laid out in front of them rather than relying on traditional map interfaces.
MARKET DRIVERS
Growth of Autonomous and Connected Vehicles to Propel Market Growth
The rise of autonomous and connected vehicles is a significant driver of the market, as these systems rely on highly accurate and constantly updated geospatial data. Self-driving cars and advanced driver assistance systems require high-definition maps that capture detailed elements, such as lane markings, road shapes, traffic signs, and barriers. For instance,
- In July 2025, HERE Technologies and BMW expanded their partnership to equip BMW’s Level 2+ and Level 3 vehicles with AI-enhanced HD maps, offering 10-cm lane-level accuracy. These maps enable cars to anticipate road conditions beyond sensor range, resulting in smoother and safer autonomous driving.
- In July 2025, Volkswagen’s autonomous-vehicle unit ADMT is partnering with Hivemapper’s Solana-based Bee Maps to improve real-time mapping for its self-driving fleet. Bee Maps contributors capture street-level imagery and earn crypto rewards, providing constantly refreshed geospatial data.
Autonomous and connected vehicles also require real-time information to respond to changing traffic conditions, construction, and unexpected obstacles. Lane-level accuracy is essential for enabling safe automated functions such as lane changes and collision avoidance. As vehicle-to-everything communication expands, cars will share more data with infrastructure, increasing the demand for advanced mapping technologies.
MARKET RESTRAINTS
High Technical and Operational Costs Hinder Market Growth
High technical and operational costs pose a significant challenge to the digital map market growth. Acquiring and updating accurate map data requires substantial investment in expensive inputs, such as satellite imagery mapping, LiDAR scans, and aerial surveys, which must be continuously refreshed to maintain the maps' relevance and accuracy. Roads, construction projects, and traffic patterns change frequently, making it both labor-intensive and capital-intensive to keep maps current.
Additionally, advanced mapping technologies, including real-time navigation, three-dimensional mapping, and augmented reality applications, require robust computing infrastructure, often relying on cloud or edge computing solutions. These technologies increase both capital expenditures and operational costs, making it more difficult for companies to manage their resources efficiently.
MARKET OPPORTUNITIES
Growing Smart-City Initiatives and Indoor Mapping Technology to Create Lucrative Growth Opportunities
Digital mapping is becoming a foundational element of modern smart cities, enabling governments and organizations to manage traffic flows, monitor infrastructure, optimize utilities, and make data-driven urban planning decisions. GIS-backed maps support environmental monitoring, sustainability initiatives, and disaster response by tracking changes in air quality, land use, water bodies, and vulnerable zones. For instance,
- In November 2025, NYC voters passed Proposal 5, replacing 8,000 borough-managed paper maps with a single digital City Map run by the Department of City Planning. The move aims to modernize mapping, streamline planning and infrastructure work, and support future smart-city technologies.
At the same time, indoor mapping technology is emerging as a significant opportunity, offering precise navigation and asset tracking within complex environments such as malls, airports, hospitals, and campuses. These indoor systems enhance user experiences, streamline facility management, and unlock location-based services for retail and commercial environments, making digital mapping a critical technology for smarter, safer, and more efficient urban and indoor ecosystems.
Segmentation Analysis
By End-user
Automotive & Transportation Segment Dominated, Driven by Rising Adoption of Autonomous Vehicles Segment Growth
Based on end-user, the market is classified into automotive & transportation, logistics & e-commerce, government & defense, telecommunication, construction & real-estate, tourism & hospitality, and others.
To know how our report can help streamline your business, Speak to Analyst
The automotive & transportation segment holds the largest share in the market, as it heavily relies on accurate, real-time mapping for navigation, route optimization, and safety systems. The growing adoption of autonomous vehicles and advanced driver-assistance systems further drives demand for high-definition, frequently updated maps. Additionally, logistics and fleet management use digital maps to enhance operational efficiency and reduce costs, reinforcing this segment’s dominant position.
The construction & real-estate segment is expected to grow at a CAGR of 18.1% over the forecast period.
By Map Type
Dynamic Maps Segment Led Market Due to its Ability to Provide Real-Time Navigation Support
In terms of map type, the market is categorized into dynamic maps, static maps, and 3D & immersive maps.
The dynamic maps captured the largest market share in 2025. In 2026, the segment is anticipated to dominate with a 67.6% share, as it provides real-time, continuously updated information, such as traffic conditions, road closures, and weather. These maps are essential for navigation, fleet management, and location-based services, offering interactive and context-aware features that static maps cannot.
The 3D & immersive maps segment is expected to grow at a CAGR of 24.3% over the forecast period.
By Location
Outdoor Segment Captured the Key Market Share due to Growing Smart-City Projects
In terms of location, the market is categorized into indoor, outdoor, and metaverse.
The outdoor segment captured the largest share of the market in 2025. In 2026, the segment is expected to dominate with a 78.7% share, as most large-scale positioning and mapping activities take place outside, including navigation, transportation, construction, and agriculture. Outdoor technologies, such as GPS and GNSS, are well-developed and widely used, offering reliable coverage over large areas. Growing smart-city projects and mobility applications further increase the demand for outdoor geospatial solutions.
Metaverse is expected to grow at a CAGR of 25.4% over the forecast period.
By Technology
Geographic Information System (GIS) Segment Held the Dominant Position due to its Ability to Visualize Spatial and Geospatial Data
In terms of technology, the market is categorized into Geographic Information System (GIS), LiDAR, digital orthophotography, aerial photography, and Global Positioning System (GPS).
The Geographic Information System (GIS) segment captured the largest share of the market in 2025. In 2026, the segment is expected to dominate with a 48.0% share, as they offer a powerful and versatile platform for collecting, analyzing, and visualizing spatial and geospatial data. GIS enables organizations across various sectors, including urban planning, transportation, utilities, agriculture, and environmental management, to make data-driven decisions, optimize resources, and enhance operational efficiency.
LiDAR is expected to grow at a CAGR of 20.1% over the forecast period.
By Application
Tracking and Telematics Segment Dominated due to its Ability to Reduce Operational Costs
In terms of location, the market is categorized into tracking and telematics, real-time location data management, risk assessment and disaster management, geocoding and geo-positioning, route planning and optimization.
The tracking and telematics segment captured the largest share of the market in 2025. In 2026, the segment is expected to dominate with a 35.3% share, as it is essential for monitoring and managing vehicles, fleets, and assets in real-time. These solutions help businesses optimize routes, reduce operational costs, enhance safety, and improve overall efficiency. High adoption across logistics, transportation, delivery services, and fleet management drives strong demand, making tracking and telematics the leading application in the geospatial market.
Real-time location data management is expected to grow at a CAGR of 19.8% over the forecast period.
Digital Map Market Regional Outlook
By geography, the market is categorized into Europe, North America, Asia Pacific, South America, and the Middle East & Africa.
North America Digital Map Market Size, 2025 (USD Billion) To get more information on the regional analysis of this market, Download Free sample
North America holds the major digital map market share, driven by its advanced geospatial infrastructure, strong GIS developer community, and significant presence of major technology and mapping companies. The region benefits from the early adoption of innovative mapping technologies, including AI-enabled spatial analytics, 3D mapping technologies, and cloud-based mapping platforms. The market is projected to reach USD 11.15 billion by 2026, with the U.S. alone contributing USD 9.14 billion, highlighting its continued leadership in global geospatial innovation and smart city initiatives.
Download Free sample to learn more about this report.
Europe holds the second-largest share of the market and is projected to maintain steady growth, reaching USD 7.56 billion by 2026. This growth is supported by the region’s rapid adoption of intelligent geospatial systems and strong data privacy frameworks, promoting secure mapping solutions and increasing investments in smart infrastructure. Major contributors include the U.K. (USD 1.30 billion), Germany (USD 1.19 billion), and France (USD 0.98 billion), which are driving regional adoption and technological innovation.
In 2026, Asia Pacific is expected to witness the highest compound annual growth rate (CAGR) in the market, with a market size valued at USD 7.56 billion. This leadership is attributed to the region’s rapid digital transformation, high smartphone and IoT device penetration, and widespread adoption of mobile-first and location-based strategies by enterprises and governments. Countries such as China (USD 3.13 billion) and India (USD 1.23 billion) are at the forefront, supported by robust GIS ecosystems, expanding 5G networks, and government initiatives promoting geospatial innovation.
The Middle East & Africa (MEA) region is expected to experience significant growth over the forecast period, reaching USD 2.00 billion by 2026. This growth is driven by increasing mobile and internet penetration, national digital mapping programs, and rising demand for geospatial solutions across government, transportation, and retail sectors. The GCC countries are projected to account for USD 0.60 billion, supported by modernization efforts and policy-driven geospatial initiatives.
South America is projected to reach USD 2.70 billion by 2026, driven by the growing adoption of digital maps for urban planning, logistics, mobile navigation, and smart mobility applications. The increasing adoption of smartphones and the expansion of GIS ecosystems across countries such as Brazil and Mexico continue to support market growth.
COMPETITIVE LANDSCAPE
Key Industry Players
Innovative Ecosystems and Strategic Integration Drive Market Leadership
The market is dominated by major technology companies that continuously innovate by integrating advanced mapping technologies, AI capabilities, and expansive geospatial ecosystems. Leading players, including Google, Apple, HERE Technologies, TomTom, and Microsoft, shape the market by providing highly accurate, scalable mapping solutions that combine extensive developer tools, real-time data feeds, and global coverage, serving billions of users across diverse industries.
These market leaders distinguish themselves through comprehensive platforms that integrate high-definition mapping, cloud-based services, machine learning, and cross-platform compatibility. Their offerings emphasize real-time updates, enhanced spatial analytics, and seamless integration with autonomous vehicles, smart cities, and location-based services. For example, Google’s extensive Maps and Earth ecosystem, Apple’s precise location services and ARKit integration, HERE Technologies’ automotive-grade mapping solutions, TomTom’s navigation and traffic intelligence products, and Microsoft’s Azure Maps platform collectively define the competitive landscape by pushing continuous innovation and delivering reliable, scalable geospatial experiences.
LIST OF KEY DIGITAL MAP COMPANIES PROFILED
- Alphabet, Inc. (U.S.)
- Apple Inc. (U.S.)
- HERE (Netherlands)
- TomTom International BV (Netherlands)
- Esri (U.S.)
- Mapbox (U.S.)
- OpenStreet Map Foundation (U.K.)
- Baidu, Inc. (China)
- Alibaba Cloud (China)
- Tencent (China)
- Vantor Holdings (U.S.)
- Trimble Inc. (U.S.)
- Carto (U.S.)
KEY INDUSTRY DEVELOPMENTS
- November 2025: A new interactive map from the University of Leeds shows that deforestation in tropical regions can raise local temperatures by up to 5°C. The tool links forest loss to heat-related mortality, affecting over 300 million people and resulting in approximately 28,000 deaths annually.
- November 2025: The Jamaica Observer reports that the Office of Utilities Regulation (OUR) launched a Hurricane Melissa Restoration webpage with an interactive map to track real-time restoration of electricity, water, and telecom services across Jamaica. The map displays each parish’s service status, percentage of restoration, and online/offline telecom sites, allowing users to view both historical and current data.
- November 2025: Africanews reports that researchers have created a high-resolution digital map and dataset of Roman roads (around 150 CE), revealing nearly 300,000 km of roads, 100,000 km not documented in previous maps of the Roman road network. The network enabled long-distance trade, troop movements, and population control, shaping Europe’s development.
- September 2025: Nashville International Airport (BNA) launched GoodMaps, an indoor navigation app designed to help all passengers, especially those who are blind or have low vision, navigate the airport independently. Using LiDAR, AI, and machine learning, the app provides turn-by-turn audio and visual guidance, detailed digital maps, and supports over 20 languages.
- July 2025: Bucknell University launched Concept3D, a new interactive 3D campus map. The platform enables users to explore the 450-acre campus virtually, view detailed building information, safety features, parking options, dining facilities, and 360-degree panoramas of key locations.
REPORT COVERAGE
Request for Customization to gain extensive market insights.
Report Scope & Segmentation
|
ATTRIBUTE |
DETAILS |
|
Study Period |
2021-2034 |
|
Base Year |
2025 |
|
Estimated Year |
2026 |
|
Forecast Period |
2026-2034 |
|
Historical Period |
2019-2024 |
|
Growth Rate |
CAGR of 14.9% from 2026-2034 |
|
Unit |
Value (USD Billion) |
|
Segmentation |
By Map Type, Location, Technology, Application, End-user, and Region |
|
By Map Type |
· Dynamic Maps · Static Maps · 3D & Immersive Maps |
|
By Location |
· Indoor · Outdoor · Metaverse |
|
By Technology |
· Geographic Information System (GIS) · LiDAR · Digital Orthophotography · Aerial Photography · Global Positioning System (GPS) |
|
By Application |
· Tracking and Telematics · Real-time Location Data Management · Risk Assessment and Disaster Management · Geocoding and Geo-positioning · Route Planning and Optimization |
|
By End-user |
· Automotive & Transportation · Logistics & E-commerce · Government & Defense · Telecommunication · Construction & Real- Estate · Tourism & Hospitality · Others (Agriculture) |
|
By Geography |
· North America (By Map Type, By Location, By Technology, By Application, By End-user, and By Country) o U.S. (By End-user) o Canada (By End-user) o Mexico (By End-user) · Europe (By Map Type, By Location, By Technology, By Application, By End-user, and By Country) o U.K. (By End-user) o Germany (By End-user) o France (By End-user) o Italy (By End-user) o Spain (By End-user) o Russia (By End-user) o Benelux (By End-user) o Nordics (By End-user) o Rest of Europe · Asia Pacific (By Map Type, By Location, By Technology, By Application, By End-user, and By Country) o China (By End-user) o India (By End-user) o Japan (By End-user) o South Korea (By End-user) o ASEAN (By End-user) o Oceania (By End-user) o Rest of Asia Pacific · Middle East and Africa (By Map Type, By Location, By Technology, By Application, By End-user, and By Country) o Turkey (By End-user) o Israel (By End-user) o GCC (By End-user) o North Africa (By End-user) o South Africa (By End-user) o Rest of MEA · South America (By Map Type, By Location, By Technology, By Application, By End-user, and By Country) o Brazil (By End-user) o Argentina (By End-user) o Rest of South America |
Frequently Asked Questions
Fortune Business Insights says that the global market value stood at USD 28.19 billion in 2025 and is projected to reach USD 94.28 billion by 2034.
In 2025, the market value stood at USD 10.06 billion.
The market is expected to exhibit a CAGR of 14.9% during the forecast period (2026-2034).
The automotive & transportation segment lead the market by end-user.
Growth of autonomous and connected vehicles is the key factor propelling market growth.
Alphabet, Apple, HERE, and TomTom are some of the prominent players in the market.
North America dominated the market in 2025.
The construction & real-estate is expected to grow with the highest CAGR.


- 2021-2034
- 2025
- 2021-2024
- 200
Get 30-60 hrs Free Customization
Expand Regional and Country Coverage, Segments Analysis, Company Profiles, Competitive Benchmarking, and End-user Insights.
Related Reports
-
US +1 833 909 2966 ( Toll Free )
-
Get In Touch With Us